14 Dec 2022
If you had to do a Football World Championship 2.0 model
An information modeler’s challenge – how would you have done it?
How is a Football World Championship really structured and what are the components required to make up the whole? Football associations, national teams, players, referees, coaches, equipment, assets such as stadiums and not least the games themselves. So, what to do with a challenge like the Football World Championship? A question the international governing body (with whom Ortelius has no commercial association) have asked and answered with, at best, mixed results in recent years. It is also a question that we at Ortelius found ourselves standing in front of a few weeks ago, at least from an information modelling point of view.
Like most workplaces, we like to have a football prediction competition during major championships. However, being information modellers, we could not resist the temptation of stretching the parameters of our competition. Could we model a football competition and break it down into it parts? And even better, could we build a model that would be sustainable enough to extend to other competitions and live into the future? After all, this is something we do for every major championship.
But where to begin? An issue which confronts us not just in the case of this model, but in any model for which we start with a blank canvas. The problem with the sky being the limit is that the sky is intimidatingly big, and a limit, initially at least, would often be quite welcome. We address this by defining a use case against which we can develop our model. What is key to remember here is that the model is not only built to solve this use case, but rather the use case gives us a frame against which to set the scope of our model. We need to define all the entities needed to solve our problem and provide immediate value, but we want to do this in such a way that those same entities can be used when additional use cases come.
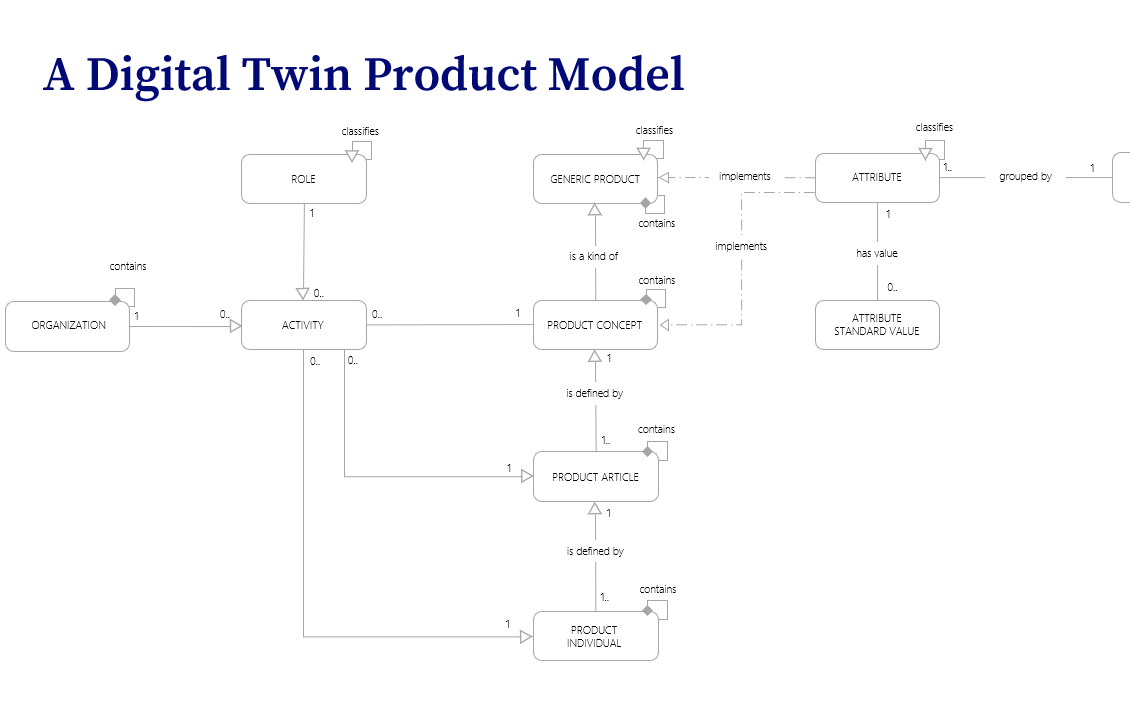
Our initial use case was of course our prediction competition. In our competition at work, all competitors would predict the results of all games and would receive points for guessing the correct result with bonus points for guessing exact scores and correct goal difference. To achieve this, we would need to model the teams to compete in the games, the games themselves, their results, and the groups and knock-out formats in which the games would occur.
(Click on image to enlarge)
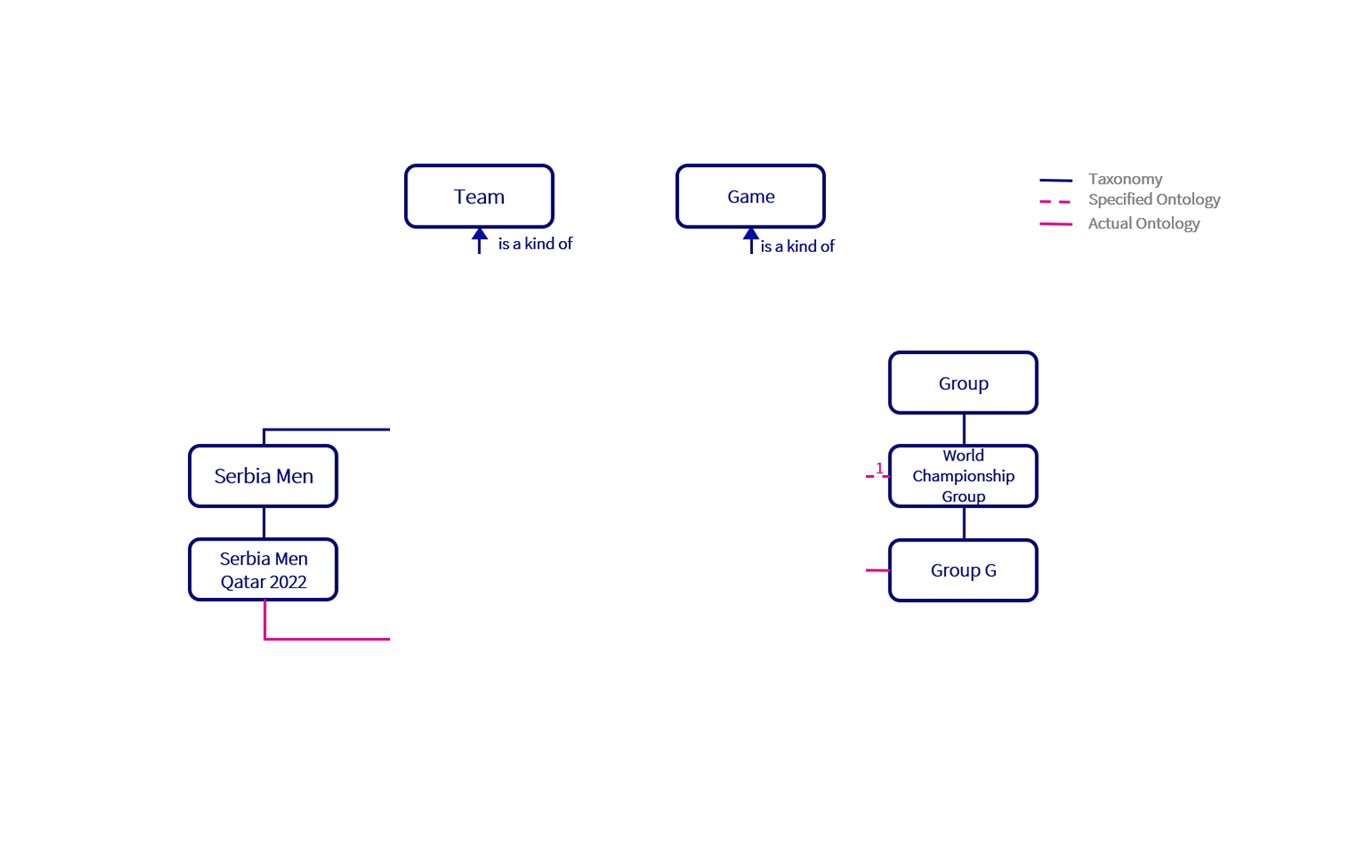
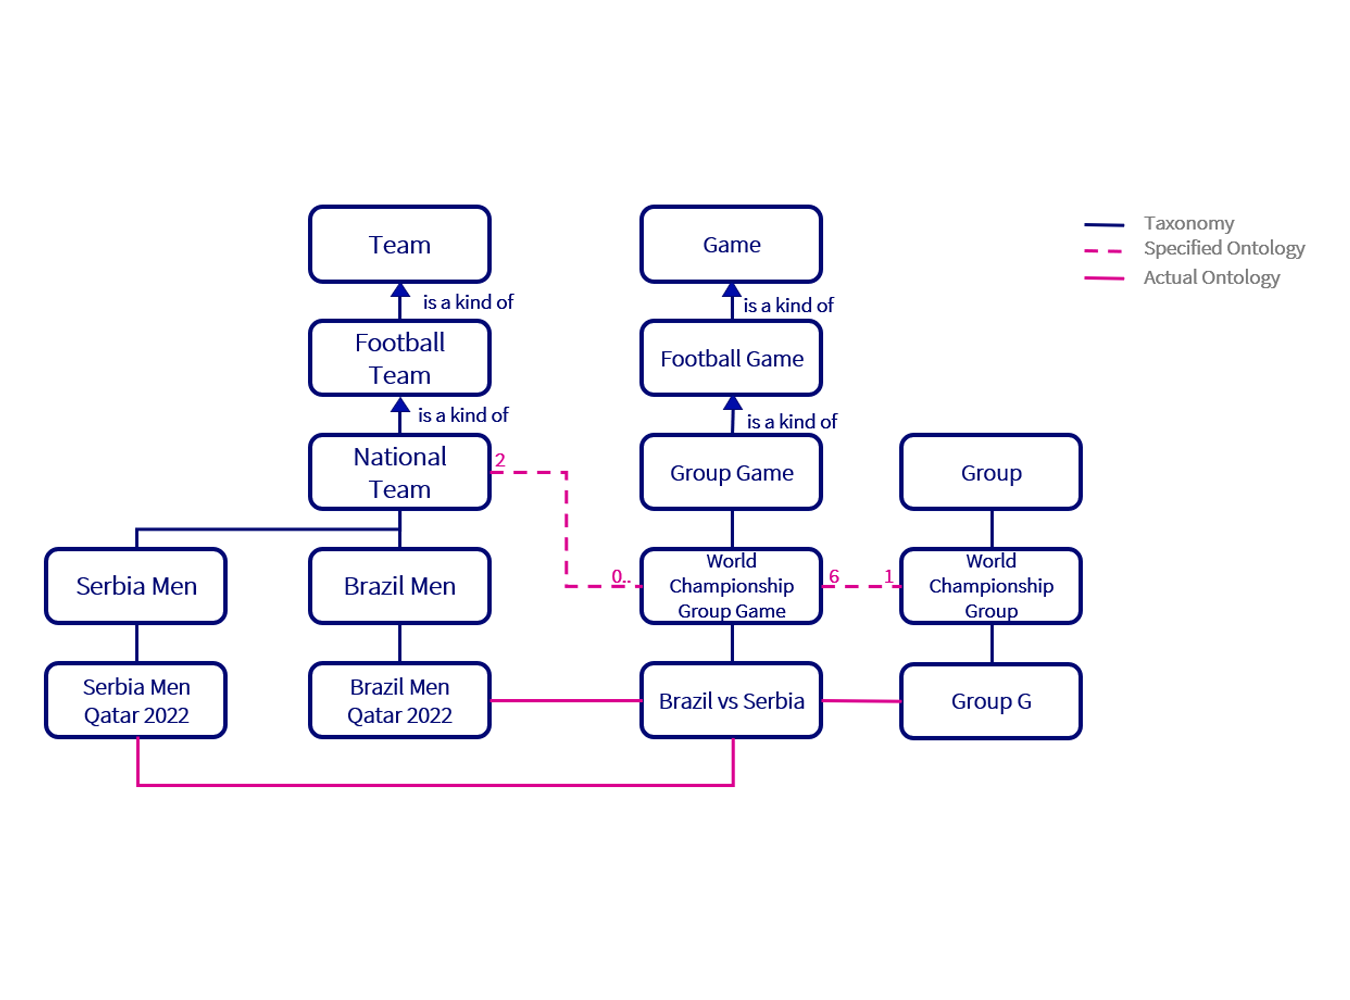
Our first step is always defining the taxonomies in our model. Creating detailed taxonomies allows us to create a surrounding ontology with connections at the right level. We can use our definition of team as an initial example. Brazil is an iconic and enduring presence in world football but current team of Neymar and Richarlison is not the same entity as the team of Rivaldo and Ronaldo. This is also the Men’s Football World Championship; Brazil has a Women’s team which would also need to be supported by this model in the future. Remember, we are building a model not only to solve our current use case but future use cases too.
In addition, Brazil is a national team with a very distinct ontology from a club team. It competes in international competitions against other national teams rather than in a domestic league against other clubs. From this, our taxonomy emerges distinguishing first between football teams and, for example, rugby teams and then branching out with club and national teams. We can then create our variants of national team such as Senior Men and Senior Women. Finally, we can create our individual teams based on these variants such as the current Brazil squad containing Neymar and Richarlison. The current Brazil squad can be connected to the Qatar Football World Championship while the concept of the Brazil national team can be connected to the Brazilian Football Association. This may seem self-evident in this case but a poorly defined taxonomies can be found at the root of a substantial number of data problems.
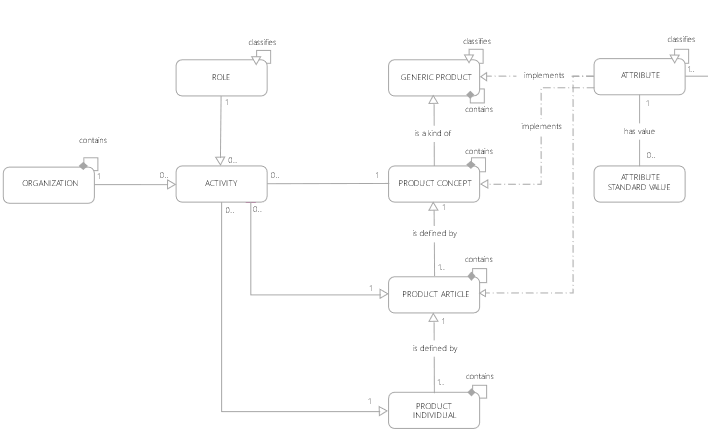
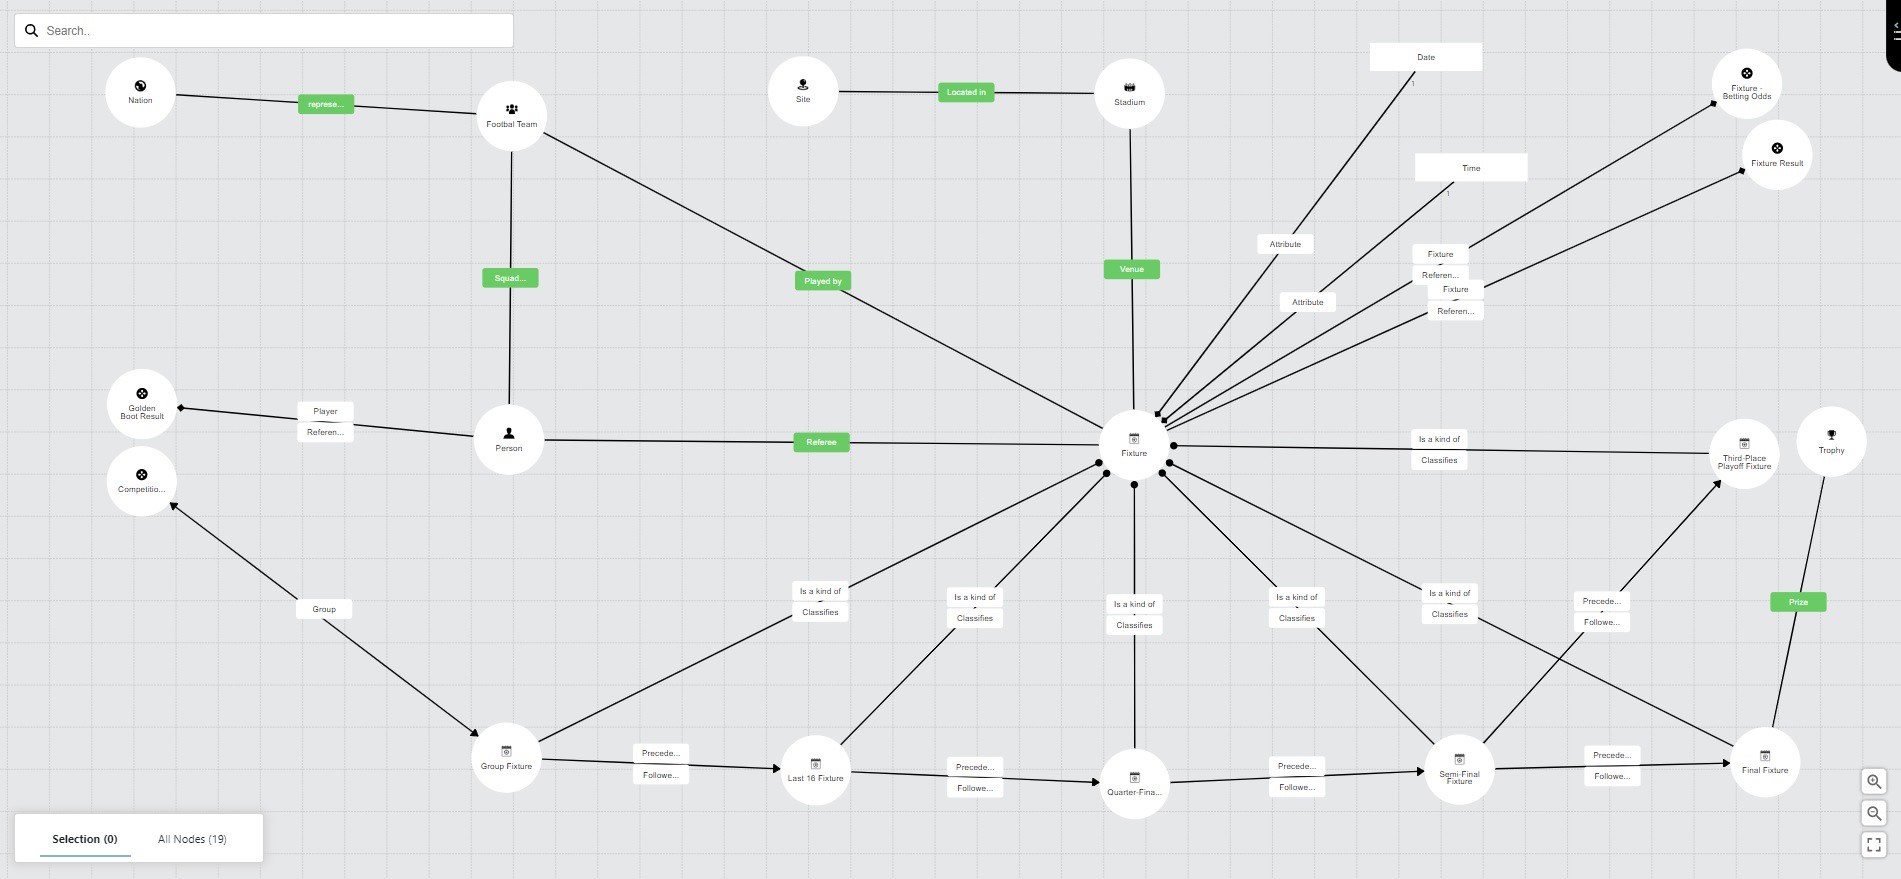
The next challenge was to define a game of football. Our starting point was to try to define it as we would any activity such as a task or manufacturing process. A game has a defined length in time, resources (players, officials, stewards, etc.), equipment (goals, footballs, cameras), an output (a result), and location (stadium). We developed our game taxonomy to differentiate between football games and other sporting games as this gives us a frame to differentiate in terms of attributes such as game length, but also a clear structure with which to connect our football games to their wider ontology. For example, group games are 90 mins and included in a group while a quarterfinal will have the potential for extra-time and penalties and will be followed by a semi-final. We can then begin our ontology work by connecting the teams we defined as a resource which enable the game much like we would connect a machine to a manufacturing process. There is a certain satisfaction in using modelling concepts that you would usually use to model a production line in a factory to solve the problem of France vs Tunisia.
(Click on image to enlarge)
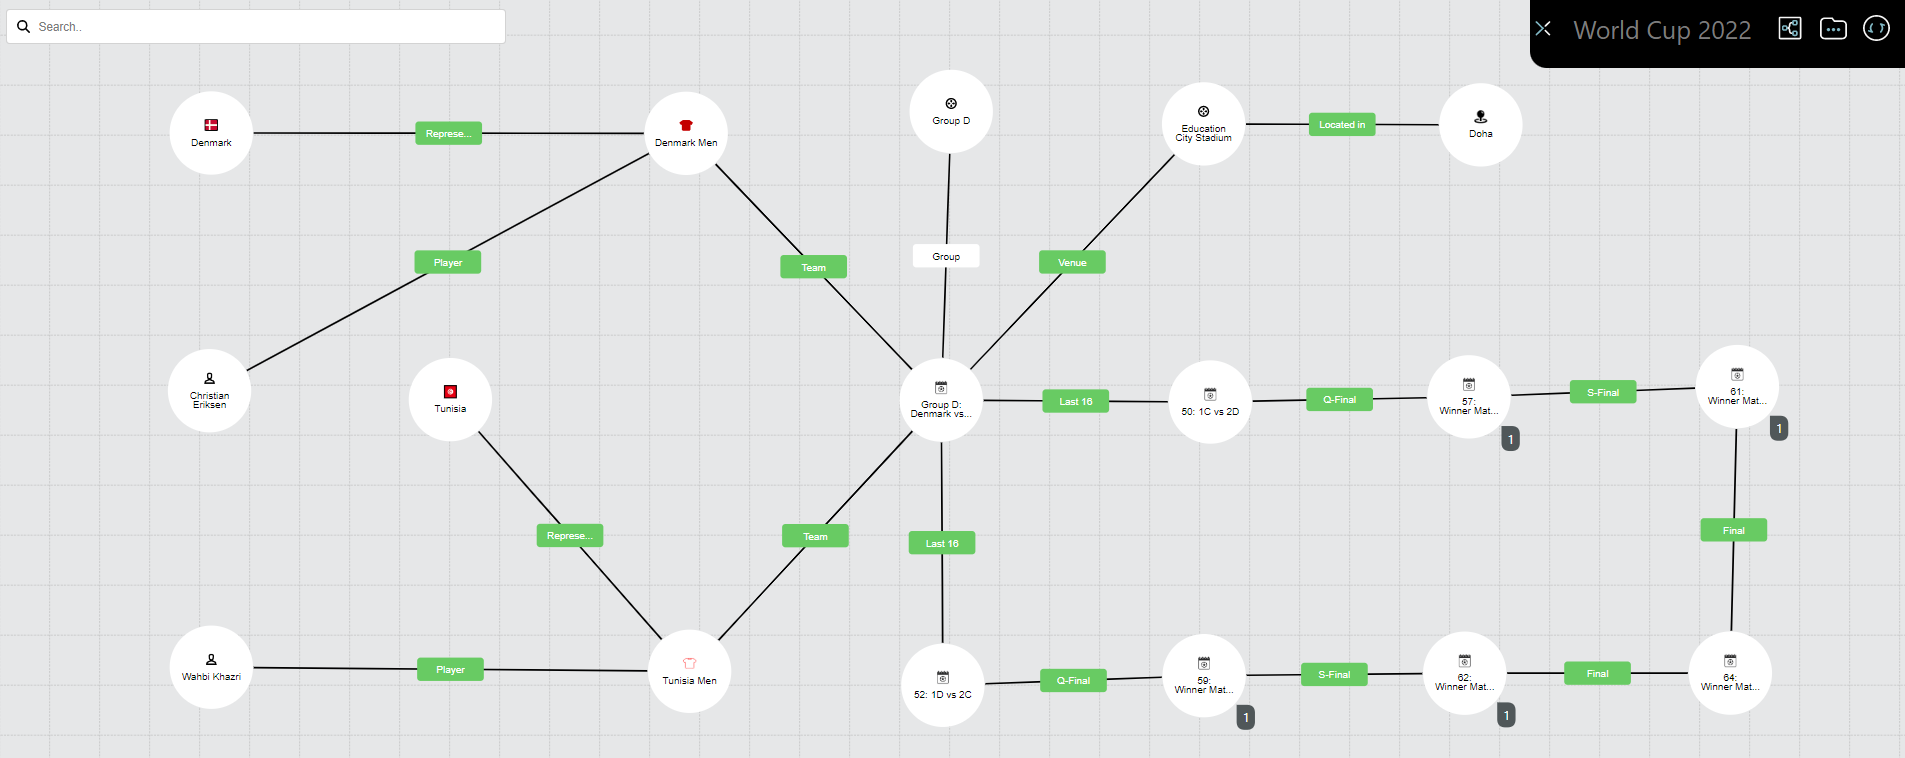
We then continued our taxonomy work defining groups and how they relate to teams and the competition as a whole. A proposal has been floated to reduce the groups to three teams in 2026 and expanding the competition to 48 teams so the nature of this taxonomy and ontology could change significantly in the future. And finally, we have our predictions. The games have an actual result of course but it is important to capture our competitors’ predictions. Again, this is much like any activity model with a forecasted and actual result.
We are now coming to the end of our competition and by populating and testing our model with data we have learned a lot about its strengths and weaknesses. Our taxonomies could do with some refining to allow better inheritance for both teams and games but that is the nature of taxonomies, they are never truly complete and need to have the flexibility to be evolved based on testing and new information.
The real challenge will come with the next tournament with which we want to test the model and we will see if it is resilient enough to embrace that one as well, but for now we should get back to doing some actual work.
(Click on images to enlarge)


/Ferdia Kehoe, Senior Information Modeler