11 Jan 2023
Doing carbon transparency right – here’s how
In 2019, Emma walked towards the meeting room that she had booked for the entire day. She only had one point on the agenda:
- Environmental Goal 2030 – Enabling our customers to be carbon neutral
“There is a high risk that we spend the entire day just discussing and we won’t get any closer to any type of action”, she thought as she entered the room. A few of her colleagues stood by the pastries and sipped coffee discussing a particular customer challenge they were working on.
“This is the third major customer this quarter who’s been requesting more granularity in traceability and carbon footprint. We’re already ahead of our competitors in carbon emission data, how can they still ask for more?”
Emma joined the conversation, “What if we did something bold, what if we had full transparency from cradle-to-cradle. Feedstock, transportation, processing, distribution, recycling – the works?”.
“It’s impossible to be that granular”, another colleague pitched in immediately.
“In this room we have some of our best experts in purchasing, supply chain and processing. Are you saying that we have a challenge in front of us that we’re not able to solve as a group”, Emma challenged him.
“Let’s begin the meeting”, Emma then announced and quickly started the meeting with this slide.
What is your biggest hairiest problem?
When I start working with my clients, I ask them:
“What’s your biggest hairiest problem?”
The answer might be something like this:
“We want to create full carbon transparency end-to-end for our products. But it’s impossible.”
My follow up question is:
“What data, information and knowledge do you need to solve this problem?”
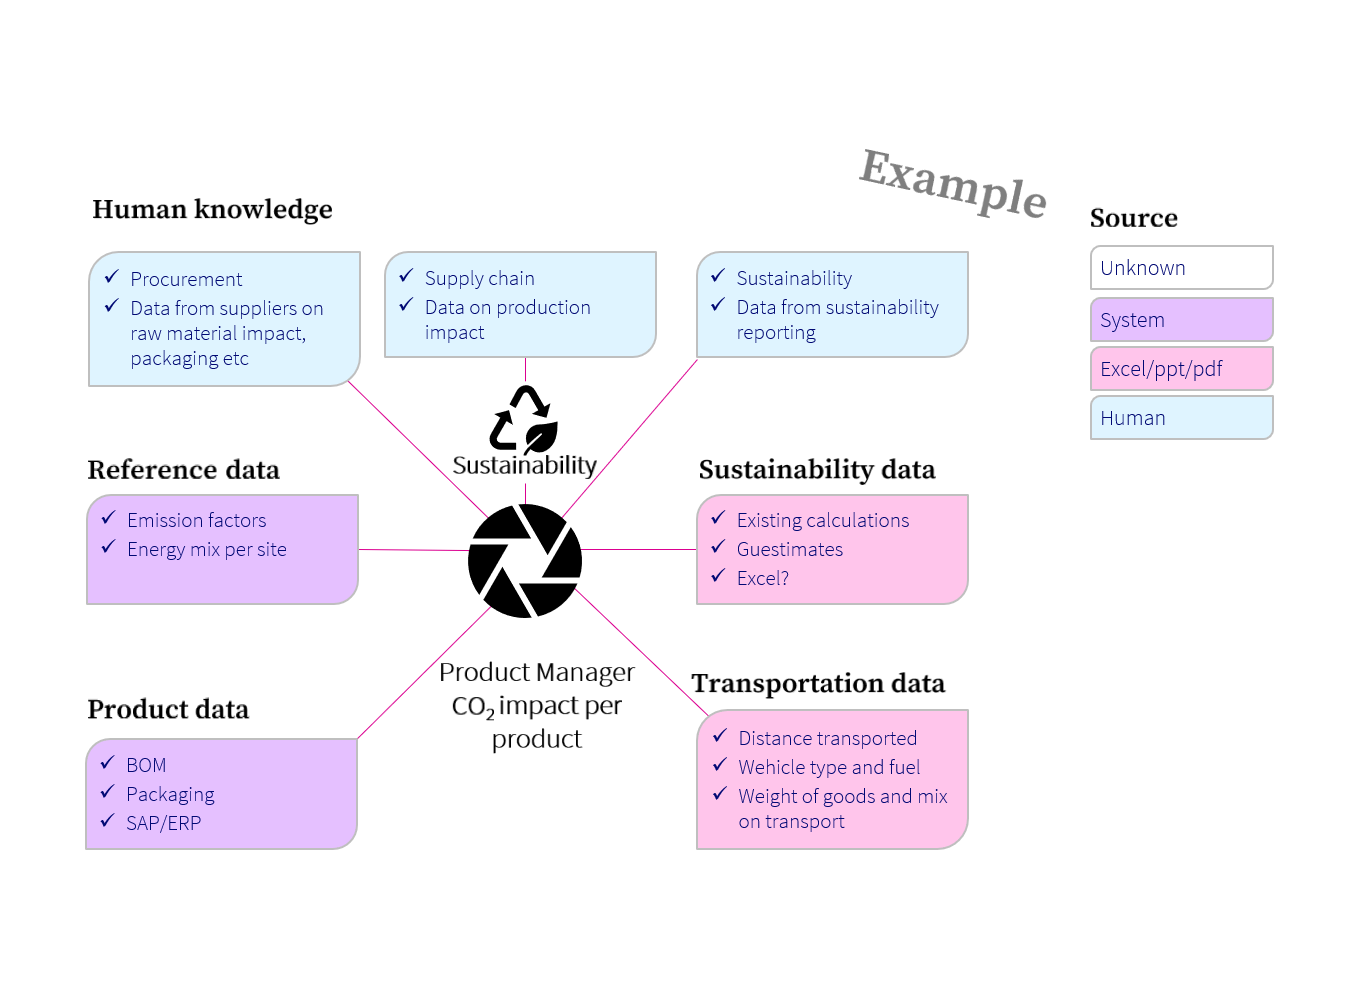
“I need to know the carbon footprint for each type of feedstock, which is something our suppliers don’t have. I need to have traceability of feedstock throughout our enrichment processes, something which we can’t do. I need to know what the carbon footprint for transportation across 5 continents with 100s of transportation companies. I need to know the energy usage for the processing of groups of feedstock in combination with the local site energy mix. We have none of this today. I don’t even know where to start.”
Narrowing it down
Let’s break down the situation in its individual pieces.
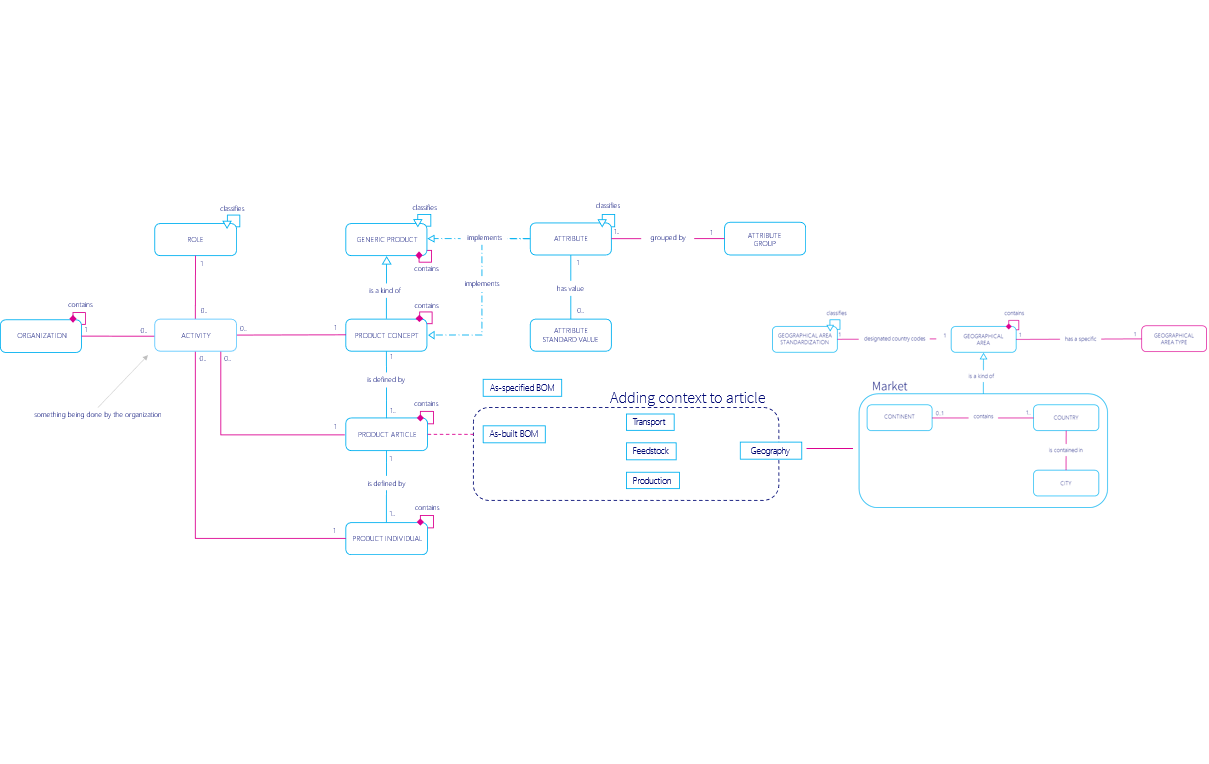
For this specific case, we need to create a data model which supports the following:
- Feedstock Types
- Relation between Feedstock Types and Product
- Product
- Transportation Methods
- Relation between Transportation Methods and Feedstock Types and/or Product
- Organization
- Relation between Transportation and Organization
- Production process
- Relation between Production Process and Feedstock and Product
- Relation between Organization and Organization through a Business Party relation
- Business Party
- Geography
- Relation between Production process and Geography
(Click on image to enlarge)
Get to work
Once you’ve narrowed down the issue in its individual parts, it’s time to get to work.
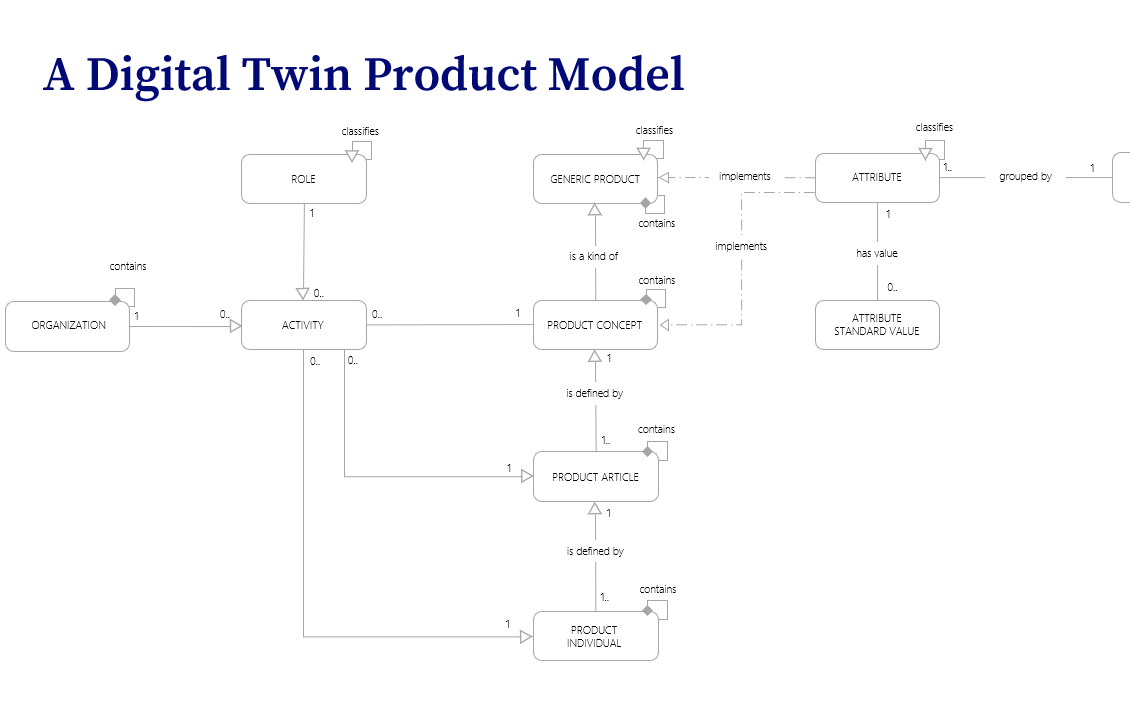
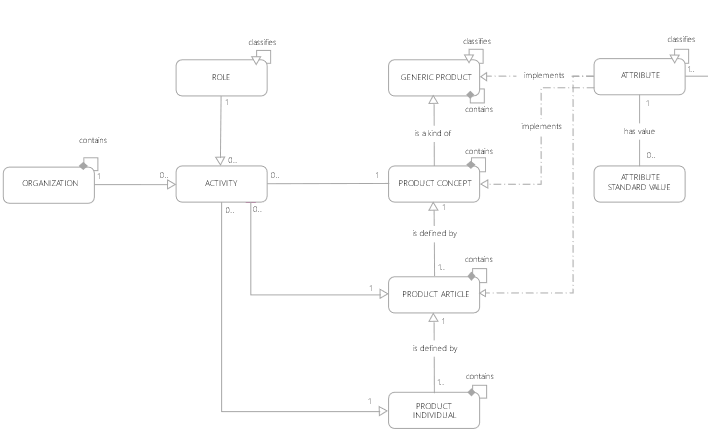
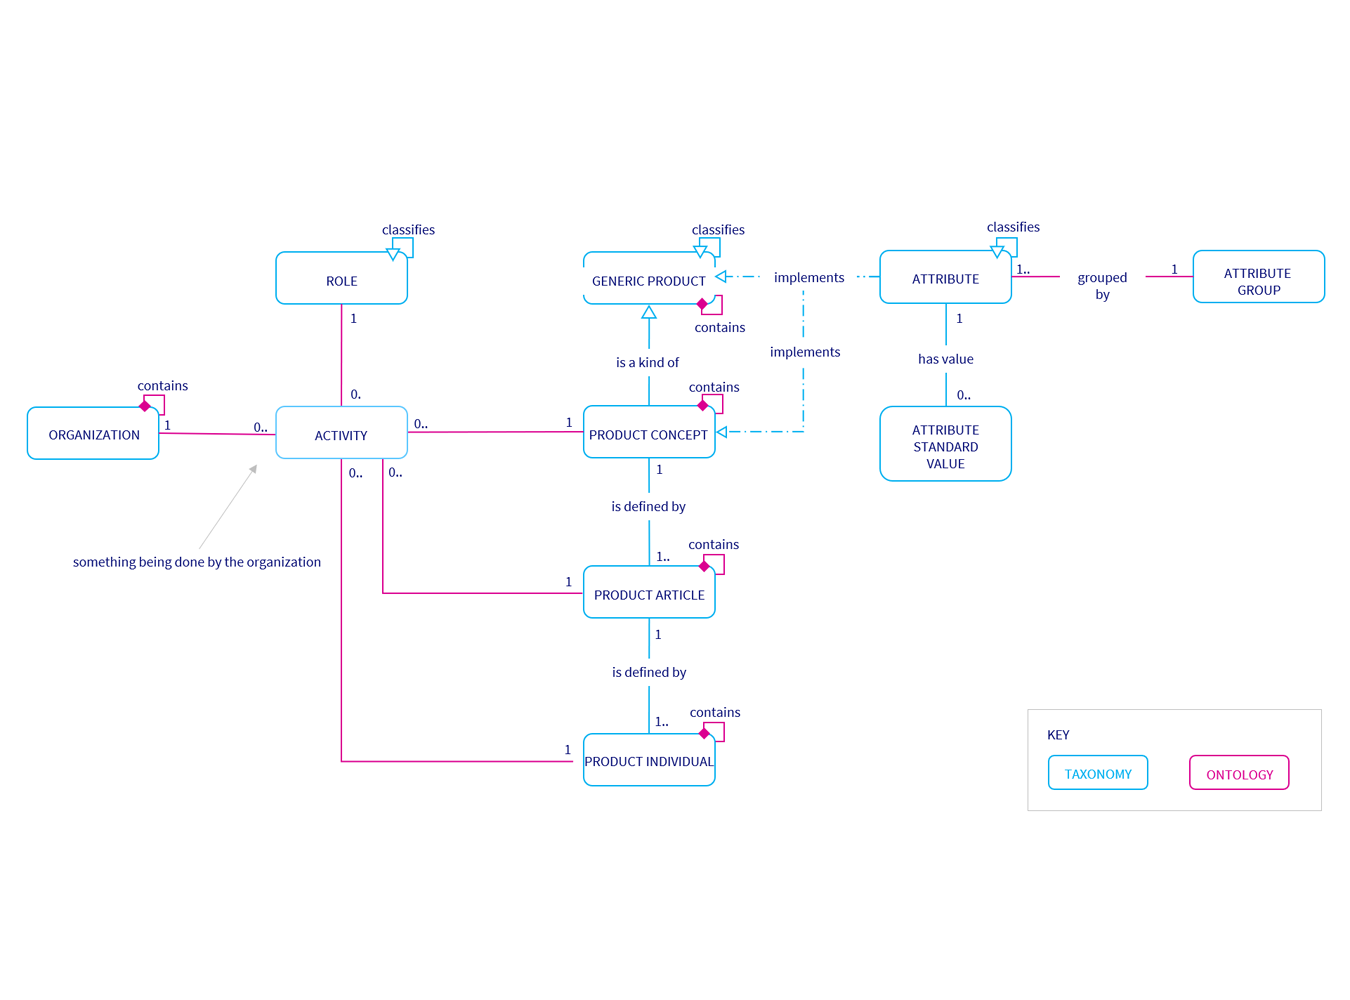
A typical Product Model looks like this. It says that (reading from bottom to top):
- A Product Individual (has its own serial number, can be bought by a customer) can consist of another Product Individual.
- A Product Individual is related to a Product Article. A Product Individual is a produced based on the Product Article’s specification. The Product Article’s MBOM creates the first Bill of Material for the individual but then the individual follows its own lifecycle, i.e. it may get new parts with new capabilities.
- A Product Article is the specification of the Product. It holds all the attribute values for the product. Product Article is what is specified by engineering (EBOM – As Specified) and what is produced by the factory (MBOM – As Built).
- A Product Article (shares an article number with other Product Articles but is not an individual product which a customer can buy).
- A Product Article is related to a Product Concept and to a combination of Organization and Role.
- A Product Concept is a Generic Variation of a Product.
- A Product Concept is a generic description of the product which is stable over time even if a new version of a Product Article is released under a new article number.
- A Product Concept is related to a combination of Organization and Role.
- Generic Product is the master classification structure which holds the definition of which Attributes are defined for each Product.
(Click on image to enlarge)
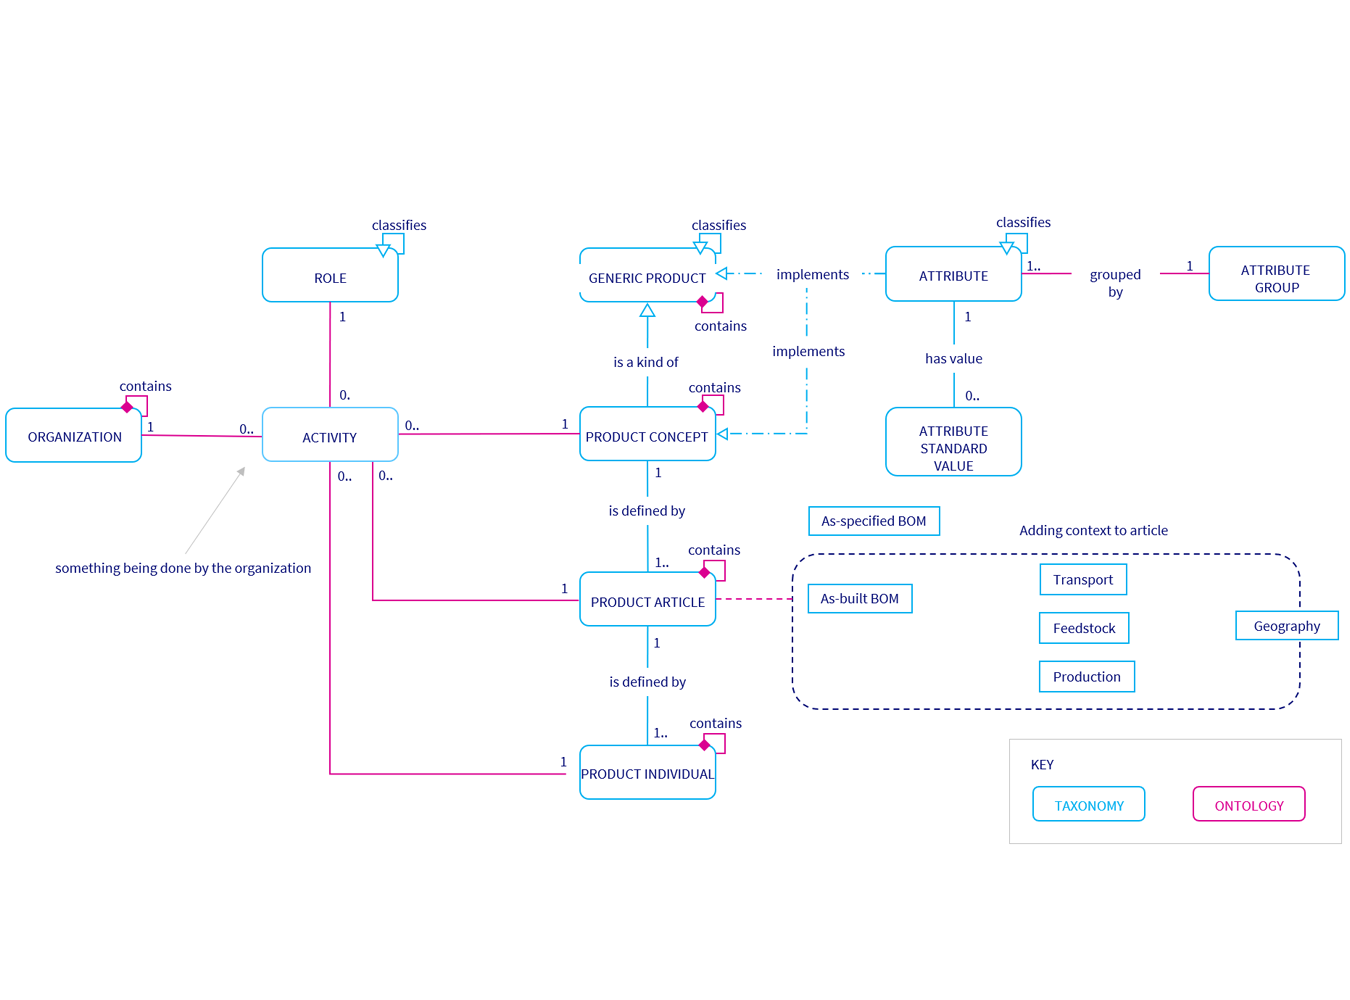
The key in solving complex data issues is to build out the data models step by step whilst ensuring connectivity to other data models. To capture Carbon Emissions the product model was extended on the article level to capture the as-built BOM.
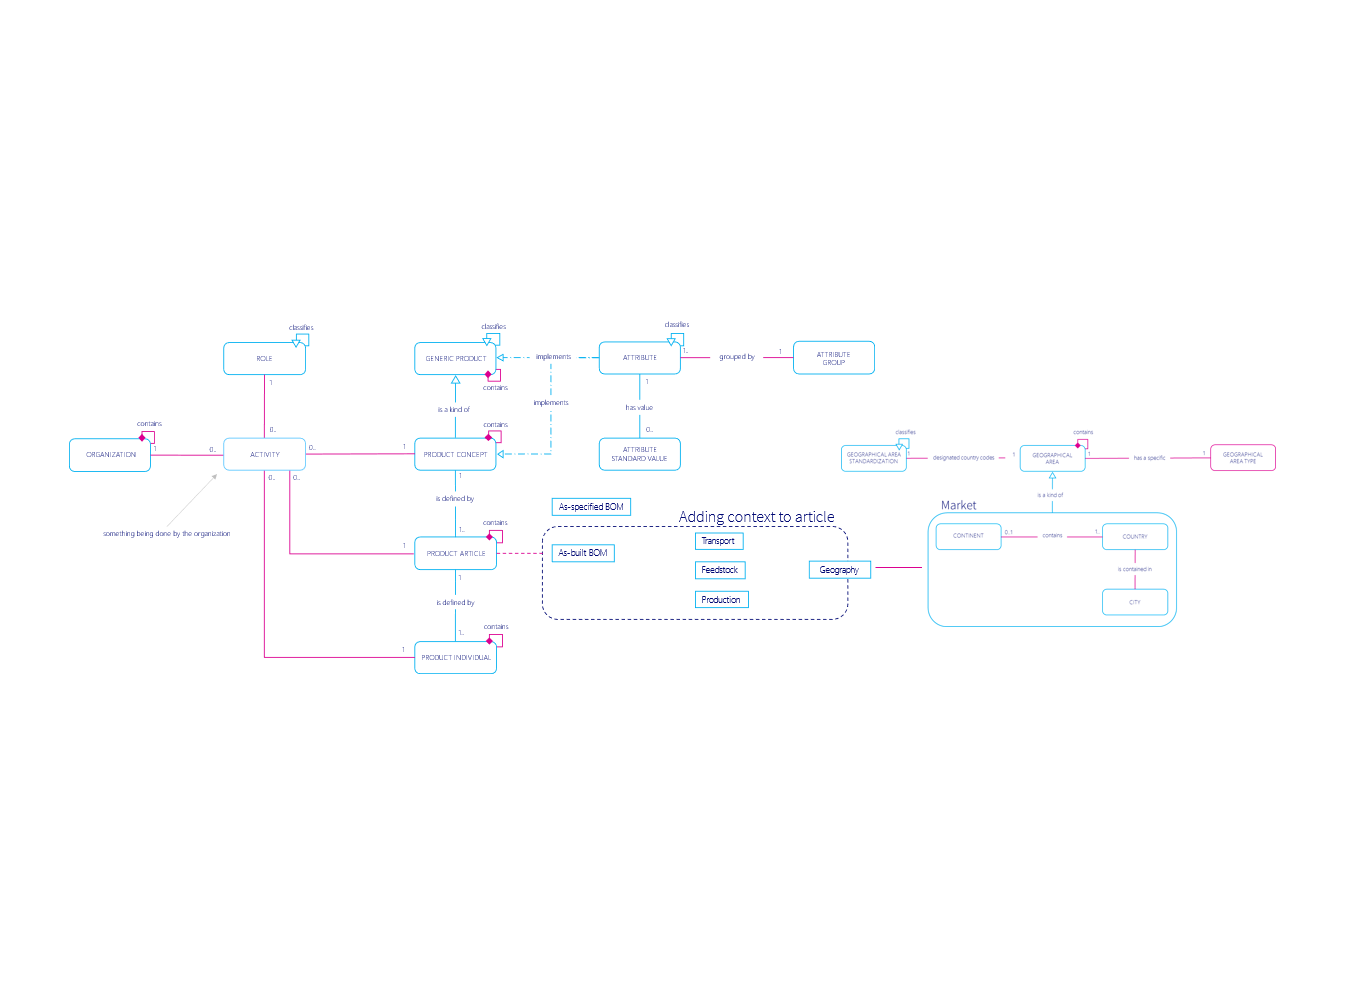
Click on images to enlarge
The model is continuously evolved, expanded and tested. Ensuring that use cases and data match are supported by the model.
An Operational Reference Model
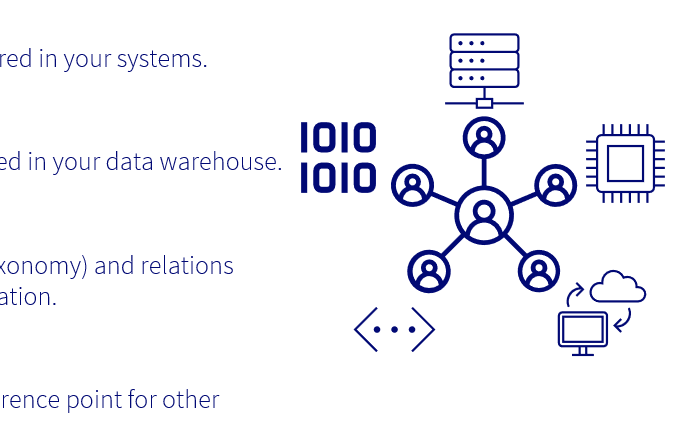
Carbon Transparency is no different. Once you have the data models defined, it’s necessary to visualize, validate and improve the data models with actual data. This is the core of what we expect from a Digital Twin Platform. This increases the demands on a data model as it needs to be live, executable and populated with real data. I call it the Operational Reference Model. If this is achieved, it will support the following functions:
- Centralized and distributed governance
- Support both centralized and distributed governance of meta and master data.
- Connectivity
- Be agile in its relation to existing solutions, to supports both existing meta and master data management solutions as well as covering gaps in those systems.
- Hold and maintain Taxonomy and ontology for increased data quality
- Taxonomy and Ontology are key elements for creating the necessary context for any AI and ML initiative. A platform designed to build, maintain and distribute taxonomies.
- Active meta data management
- To manage and maintain simple-to-complex meta data which is used in PLM, ERP, CRM, PIM, PDM and MDM as a common language for data exchange.
New capabilities
Going back to Emma, what happened after her full day working meeting?
She had an ace up her sleeve, as she already had an Operational Reference Model in place for Product which gave her a head start. Before the end of the year, she was able to deliver new capabilities to the organization:
- Supporting the business with environmental information to be able to give correct information to customers.
- Supporting the consumer demands connected to environmental information.
- Be able to simulate (future demands on) product configuration in an environmentally friendly way.
The 2030 vision that seemed impossible at first, was now perceived as achievable. One step at a time. The requirements were in place, the roadmap to achieve it was set. Suppliers were informed of data requirement ramp-up the coming years. The key was envisioning the future, taking a future back mindset, and going backwards to define what is necessary today.
To do carbon transparency right is possible. What happens if you don’t do it – for your own organization or your customers?
/Daniel Lundin, Head of Product & Services

