Author Archive

In the Age of Intangible Assets

Publicerad: 22 May, 2023 av Alexandra Jerrebro |

In the heart of Stockholm at the dawn of a typical workday Erik Johansson, an experienced asset manager, looked out at the cityscape from his high-rise office. He had always enjoyed the predictability of his routine, the familiarity of his responsibilities – overseeing the company’s assets, from machinery to real estate. But today was different. Erik found himself on the cusp of a revelation that would challenge his understanding and shift his perspective. This was the beginning of his journey.

Erik had recently been introduced to the concept of intangible assets, those elusive often overlooked assets that held extraordinary value in the digital age.

He began to realize the wealth of data his company generated and processed daily, the intellectual property they developed, and the reputation they had built, all contributed to a vast reservoir of intangible assets.

Erik felt like he was standing at the mouth of a labyrinth, equipped with a map that only showed the physical world. The intangible assets were like a hidden dimension, waiting to be discovered and managed. He realized his role as an asset manager was about to expand significantly. All he needed was a new multi-dimensional map, and a language to describe the coordinates and their relations.

His call to adventure had arrived. Exploring Digital Twins and Operational Reference Models.

Embracing this new challenge, Erik began to explore the realm of intangible assets. He immersed himself in learning about digital twins – virtual replicas that could replicate the performance of physical entities in real-time. He learned how his enterprise with the help of these digital twins could begin to predict potential issues, optimize resources and reduce costs. The more he discovered, the more he realized the potential they held for revolutionizing asset management. Soon he encountered a new capability which he hadn’t seen before. An Operational Reference Model (ORM) which was a framework that bridged the gap between physical machines, processes, humans, and entire production lines. ORM came coupled with capabilities to manage and govern taxonomies and ontologies which in turn provided structure and context to data. Erik began to see the possibility of a holistic view of his assets.

But he persisted, his conviction unwavering. He demonstrated the benefits of managing intangible assets in a new way, providing new and unseen capabilities and dependencies. He also experimented with scenarios for the future, what if’s and could be’s, all supported by the ORM to ensure a holistic perspective.

This was his road of trials. Erik faced initial resistance from his team, a natural reaction to change.

With the help of external ORM specialists, Erik integrated ORM with taxonomies and ontologies, into his asset management strategy. Erik’s transformation was underway. Armed with this newfound knowledge and the tools to manage both tangible and intangible assets, Erik began to make significant strides. Together with his architects and IT department he formed a true transformation team. The team enabled the enterprise to begin using the power of digital twins to optimize resources, cut costs, and improve efficiency. He adopted ORM to gain a comprehensive understanding of his company’s assets and orchestrated a common language for his business. This enabled a new era of informed decision-making in the enterprise.

Across the enterprise he saw tangible benefits, as intangible assets were finally recognized and managed effectively. Erik had crossed the threshold.

He had journeyed from a conventional asset manager, overseeing physical assets, to a pioneering figure embracing the complex world of intangible assets. His role had evolved and with it he was driving his company towards a more innovative, integrated, and effective approach to asset management.

In the words of Benjamin Franklin, “An investment in knowledge pays the best interest.” Erik’s journey was a testament to this. His investment in the knowledge of intangible assets and their management has paved the way for continued innovation and success within his organization. His journey has transformed him from an asset manager to a strategic guide (and hero), navigating his organization through the complex landscape of the digital age.

As Erik’s journey reaches its conclusion, he brings back with him a wealth of insights and experiences. He shares his new understanding with his team which helps fostering a culture that recognizes the value of intangible assets. His story inspires others in his field to embark on their own journeys of discovery and transformation.

Erik’s journey is a testament to the evolving role of asset managers in today’s rapidly digitizing world.

It illustrates the importance of integrating modern digital tools and methodologies, such as digital twins and capabilities like an Operational Reference Model, to gain a 360-degree perspective on both tangible and intangible assets.

Through Erik’s transformation we see the emergence of a new era in asset management – an era where intangible assets are recognized for their immense value and potential.

An era where asset managers evolve from custodians of physical assets to strategic guides, navigating the labyrinth of intangible assets.

Erik’s story is just the beginning. There are countless other asset managers out there, standing on the cusp of their own journey.

In this evolving landscape, the dialogue continues: Are you ready to embark on this journey? Are you prepared to expand your understanding and evolve your asset management strategies? Are you ready to embrace the paradox of intangible assets and harness their potential? The future of asset management is here. Let us embrace it, evolve with it, and drive our organizations towards continued innovation and success.

The importance of intangible assets

As Erik’s journey illuminates the importance of intangible assets, such as data and information about our capabilities, has increased exponentially. Today data and information has become a key driver of growth. Companies like Facebook and Google rely heavily on user data to generate revenue. Data is a key factor in driving business decisions, innovation, and customer experiences. Companies in manufacturing and healthcare has started to understand the importance of information as a way to capture and automate complex knowledge that resides in the minds of people or is embedded in a product, service or process. Like other types of assets, intangible assets are essential to the organization’s success.

Navigating the challenges and complexities of managing intangible assets is crucial to unlocking their full potential. Ensuring data accuracy, data security, and compliance is fundamental to maintain trust and protect company reputation. Ensuring an evolvable operational information model means a common language and true transparency cross the organization to provide the real foundation for a data driven enterprise. This is where the role of an asset manager becomes even more critical.

It involves not just overseeing physical assets but also ensuring that data and information are accessible, accurate and secure
– and has a common point of reference.

Deriving value from intangible assets, like knowledge, information and data, requires managing them with a set of tools designed and built for purpose. It’s not only big data, but also small data. Metadata is small data which provides data with context, it also provides context in terms of relations to other data. Without it, asset management is hard and only available to a small group of people within a company. Rapid advancements in technology, including the rise of artificial intelligence and machine learning, have shifted the value landscape. These advancements have opened up new opportunities for businesses to leverage data.

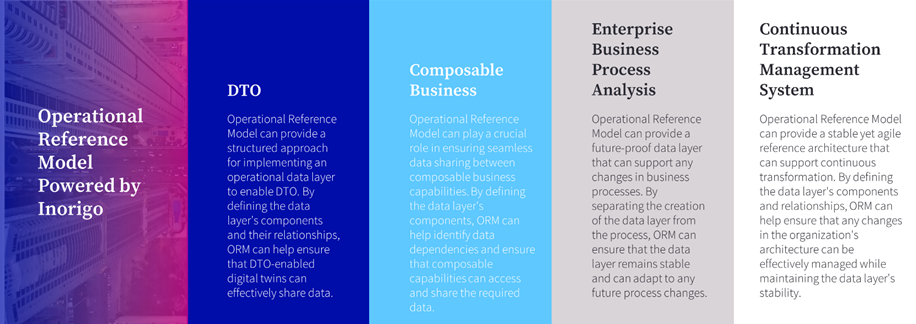
Intangible assets, particularly data, need specific models, methods, and technologies to forecast performance and simulate decision-making processes. This is where digital twins and ORM come into play. Digital twins are virtual representations of assets (both physical and virtual) used for monitoring, simulation, and optimization. The ORM on the other hand provides the structure necessary to succeed with data management.

To illustrate, consider a wind turbine farm using digital twins for each turbine. The digital twins collect data on the turbines’ performance, such as wind speed, energy output, and temperature. By analyzing this data in real-time, the digital twin can identify potential issues or inefficiencies, such as a misaligned blade or an overheating gearbox, before they lead to a critical failure. ORM, in the meantime, provides a framework for managing these data points, ensuring that they are accurately captured, categorized, and accessible when needed. This allows to learn from other wind turbine farms and copy best practice with a different configuration of a wind farm (location, layout and manufacturer).

The use of digital twins and ORM in asset management is just one part of the equation. It’s also important to recognize that intangible assets like Spotify’s vast data on listening habits, Tesla’s patents and technology, and Netflix’s customer data all contribute to their respective company’s competitive edge. As such, asset managers today need to factor in these intangible assets when developing and implementing asset management strategies.

Erik’s journey underscores the importance of leveraging modern digital tools and methodologies to manage both tangible and intangible assets effectively. His transformation from a traditional asset manager to a strategic guide navigating the complex landscape of the digital age is indicative of the shift happening within the asset management industry.

As we continue to evolve in this new era of asset management, it’s essential to engage in dialogue and share insights. Are you ready to expand our understanding and evolve our asset management strategies? Are you prepared to embrace the paradox of intangible assets and harness their potential? Let’s continue the conversation and drive our organizations towards innovation and success in the digital age.

More on this topic: ISO TC 251 Asset Management Plenary Session

Other suggested blogs: Democratization of Data, A Game Changer for Productivity and Business Intelligence

/Daniel Lundin, Head of Product & Services

Daniel Lundin Ortelius digital twin

A Game Changer for Productivity and Business Intelligence

Publicerad: 4 April, 2023 av Alexandra Jerrebro |

Discover the value of meta metadata and how it can revolutionize the way your business can analyze and utilize data for both productivity and decision-making.

Understanding Meta Metadata

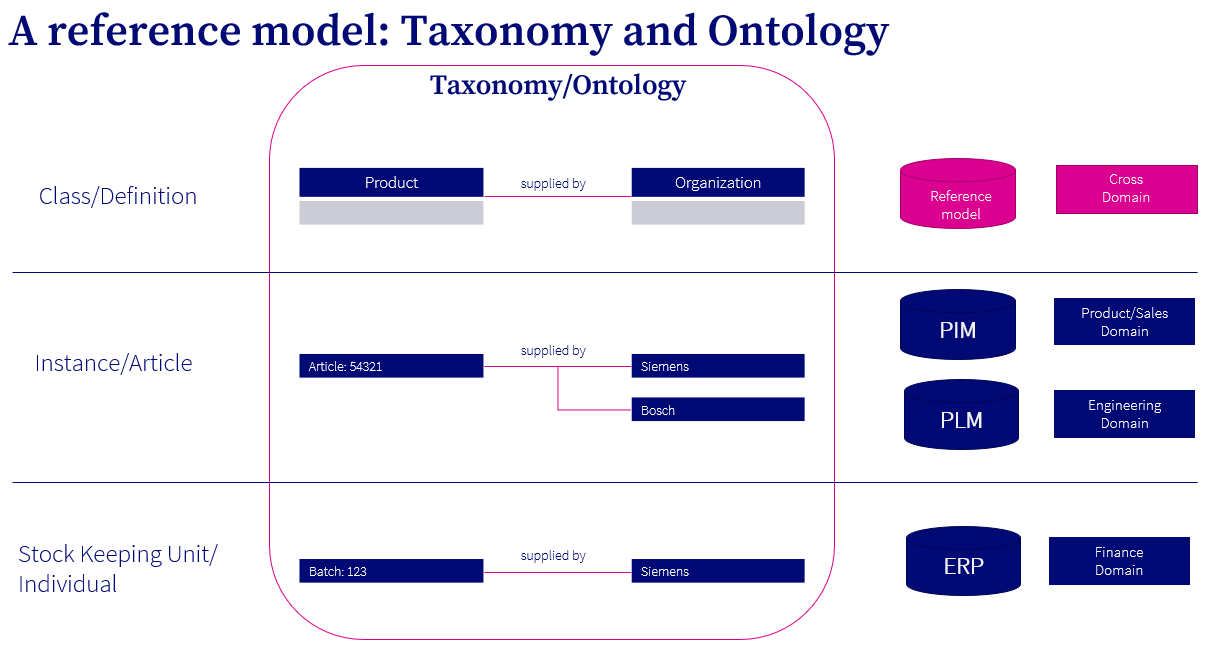
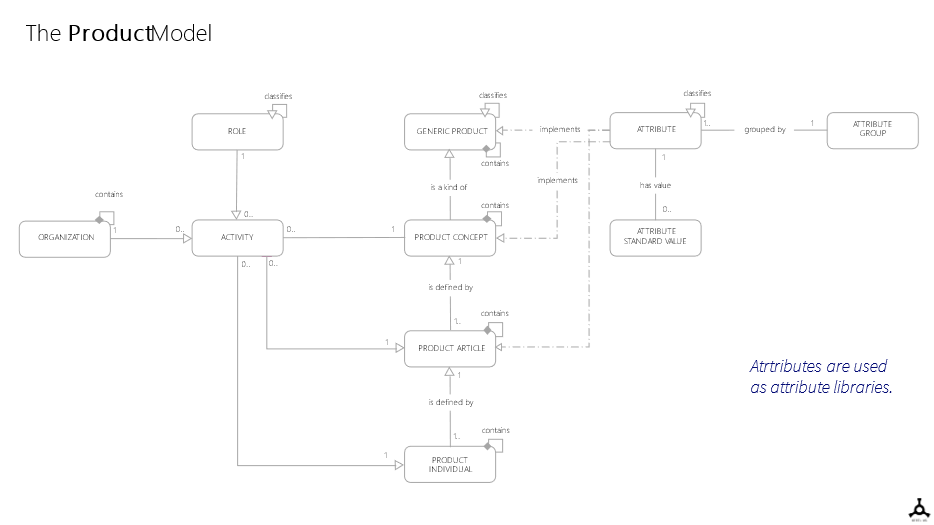
Meta metadata is essentially data about metadata. It describes the structure and models of metadata, such as classification structures (taxonomies) and its ontologies. By providing a comprehensive view of the underlying structure and relationships between different data elements, meta metadata allows people to better understand the nuances and complexities of their data. Often leading to more accurate insights and enables the organization to make better decisions. Consider the example of a product. A specific product unit with a unique serial number is a Product Individual, while the Product Article refers to the Product as engineering designed (EBOM). The Product Concept is a grouping of several article, for example you have several articles for the same product with different power cables for different geographies. In this context, the Product Article is metadata for the Product Individual, while the Product Concept is its meta-metadata. This multi-layered structure helps capture the intricacies of data relationships, which can significantly improve data management and analysis.

Click to enlarge image

Supporting Technologies

To effectively work with meta metadata, businesses can leverage several key tools and technologies, including taxonomies, ontologies, and semantics.

  • Taxonomies: These provide a logical, hierarchical structure for organizing and classifying data. For example, a taxonomy can classify vehicles into cars and motorcycles, and further classify cars into SUVs, sedans, and station wagons.
  • Ontologies: These help define the relationships between different data elements, such as “is manufactured by,” “is employed by,” and “is owned by.” In our earlier example, a V90 could be identified as a station wagon manufactured by Volvo Cars.
  • Semantics: Often considered part of ontologies, semantics ensure that data elements have clear definitions, units of measure, and popular names for easy reference and understanding.

To manage these elements, businesses can use an object database for maintaining taxonomies, a relational database or knowledge graph for ontologies, and a data catalog or similar tool for semantics. By combining these technologies, organizations can create a robust foundation for meta metadata management and analysis.

Click image to enlarge

People, Processes, and Way of Working – or becoming data literate

Incorporating meta metadata management into an organization’s culture is a critical step towards effectively utilizing data for decision-making.  All of these elements can be considered part of being data literate. This process involves several key components:

  • Training and education: Equip employees with the knowledge and skills needed to understand and work with data, metadata and meta metadata. This may include workshops, online courses, and hands-on exercises to familiarize team members with data concepts and tools.
  • Collaboration: Encourage cross-functional collaboration between departments to ensure that data, metadata and meta metadata is effectively utilized throughout the organization. This can help break down silos and promote a shared understanding of data structures and relationships.
  • Data governance framework: Implement a comprehensive data governance framework that outlines policies, procedures, and best practices for managing your data, metadata and meta metadata. The framework should include governance principles for data quality, security, privacy, and compliance.
  • Continuous improvement: Regularly review and update all of your data management practices to ensure that they remain aligned with the organization’s goals and objectives. This may involve incorporating feedback from employees, conducting audits, and benchmarking against industry standards.

The Role of Documentation

Documentation of meta metadata involves several key elements such as structure (taxonomies and classification), relationships and context of data (ontologies). This makes it easier for both technical and non-technical users to understand and work with the information which, in turn, promotes better collaboration, knowledge sharing, and data-driven decision-making across the organization. Documentation is crucial, but often disconnected from daily operations. The core element is then to Operationalize the Taxonomies and Ontologies and make them a part of the IT infrastructure. This is what we call an Operational Reference Model which in turn enables several capabilities, such as Digital Twin of an Organization and Composable Enterprise:

  • Having an Operational Information Model ensures the blueprint or architecture is not stale but actively used across the entire system landscape. Then documentation on the entities and relations are attached to the model.
  • Metadata standards and guidelines: Establishing clear standards and guidelines for metadata documentation ensures that all employees are on the same page when it comes to defining and documenting data elements. This can include guidelines on naming conventions, data types, and relationships.
  • Version control and change management: As data structures and relationships evolve over time, it’s important to maintain a record of these changes to ensure accurate and up-to-date documentation. Implementing version control and change management processes can help organizations track and manage updates to their meta metadata.

Click image to enlarge

Business Benefits and Value of Meta Metadata

There are several significant benefits to effectively managing and leveraging meta metadata:

  • Reduced integration costs: By maintaining a clear understanding of data structures and relationships, businesses can more easily integrate new systems and data sources.
  • Improved accuracy in analytics: Meta metadata helps organizations avoid half-truths and misconceptions in their dashboards, leading to more accurate insights and enables better decision-making.
  • Increased resilience and adaptability to change: With a comprehensive understanding of their data, organizations and their metadata they can more smoothly replace or update systems without incurring excessive costs or delays.

In addition to the benefits previously discussed, there are several other advantages to effectively managing and leveraging and activating any type of metadata in an organization:

  • Enhanced data discovery: With a comprehensive understanding of their data’s structure and relationships, organizations can more easily discover and access relevant information for their needs, reducing time spent on manual data searches and improving overall productivity.
  • Streamlined data reporting: Meta metadata enables businesses to generate more consistent and accurate reports, as the underlying data structures and relationships are well-documented and understood. This can lead to better communication and decision-making within the organization.

Evolution of Observability and Lineage

The concept of meta metadata ties closely to the evolution of observability and lineage in data management. Observability is the ability to monitor and understand the state of a system based on its external outputs, while lineage refers to the tracking of data provenance and transformations. By having the ability to maintain and analyze data on a data-, metadata- and meta metadata level businesses can enhance observability and lineage, leading to better data quality, accuracy, and traceability.

As businesses become more data-driven, the importance of observability and lineage continues to grow. Several trends and developments are driving this evolution:

  • Increased data complexity: As organizations collect and process more data from diverse sources, the complexity of their data landscape grows. This makes it even more critical to maintain a comprehensive understanding of data structures and relationships, which meta metadata can provide.
  • Data privacy and compliance: With the introduction of stricter data privacy regulations such as GDPR and CCPA, organizations must be more diligent in tracking and managing data provenance and lineage to ensure compliance.
  • Artificial intelligence and machine learning: As AI and ML technologies become more prevalent, the need for high-quality, well-structured data becomes even more important. Meta metadata can help ensure that these advanced analytics tools have access to accurate, consistent, and well-documented information.

Information Modeling and Meta Metadata

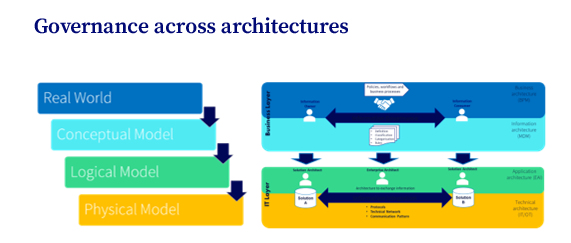
Information modeling is the process of creating a visual representation of an organization’s data structures and the relationships between different types of data. It plays a crucial role in understanding and working with meta metadata. By creating comprehensive information models, businesses can better visualize and understand the complex relationships between different data elements. This, in turn, helps organizations maintain accurate, consistent, and well-organized meta metadata, ultimately leading to more effective data management and analytics.

There are several approaches to information modeling that can help organizations better understand and manage their data:

  • Conceptual modeling: This high-level, abstract approach focuses on defining the main entities, attributes, and relationships within an organization. It helps stakeholders gain a high-level understanding of the information landscape and provides a foundation for more detailed modeling.
  • Logical modeling: This approach refines the conceptual model by adding more detail and structure to entities, attributes, and relationships. Logical modeling typically includes defining primary and foreign keys, as well as incorporating business rules and constraints.
  • Physical modeling: This level of modeling focuses on the specific implementation details of the model within a particular database or storage system. It includes aspects such as table structures, indexing, and partitioning.

By employing these information modeling approaches, businesses can create a clear and comprehensive understanding of their data landscape, making it easier to manage and utilize data effectively.

Click image to enlarge

Conclusion

Meta metadata is an often-overlooked aspect of data management that holds immense potential for businesses in terms of productivity and decision-making. By understanding and effectively managing meta metadata, organizations can reap numerous benefits, including reduced integration costs, improved accuracy in analytics, and increased resilience to change.

To fully harness the power of meta metadata, businesses must invest in supporting technologies such as taxonomies, ontologies, and semantics, and ensure that their people, processes, and ways of working are aligned with data management best practices. Additionally, proper documentation, observability, lineage, and data modeling are essential for successfully navigating the complexities of meta metadata.

In an increasingly data-driven world, organizations that prioritize meta metadata management will be better positioned to make informed, sustainable decisions and thrive in the competitive business landscape.

Webinar

For more information, please watch Ortelius and Leit Data‘s webinar:

/Daniel Lundin, Head of Product & Services
Daniel Lundin Ortelius digital twin


Democratization of data

Publicerad: 8 February, 2023 av Alexandra Jerrebro |

Part 1: Democratization of data requires a common language and shared definitions

Deep within the labyrinthine corridors of a sprawling corporation, a battle was being waged. On one side, the Chief Data Officer, Sarah, armed with her knowledge of data governance and her unyielding determination to bring order to the chaos of conflicting data definitions. On the other, the departmental silos, each guarding their own unique terminology and metrics.

As Sarah delved deeper into the problem, she realized that the root of the issue was a lack of a common language for data and information. Without a common reference library, collaboration between teams was nearly impossible and trust in the data was non-existent.

Determined to crack the code and bring unity to the organization, Sarah thought back to her university studies and remembered the Rosetta Stone. What if she could create a Rosetta Stone for her organization’s data, providing a clear and consistent meaning for all terms and metrics – in the language of each department.

But the true test of her solution came when she presented it to the departmental leaders, the guardians of the silos. Would they accept this outsider’s attempt to impose a new order on their cherished data?

The meeting was tense, each departmental representative fiercely defending their own terminology and methods. But as Sarah presented her findings, a sense of understanding began to dawn on the group. With a common language, collaboration between teams would improve, data-driven decisions would be more accurate and the company’s bottom line would receive a much-needed boost.

Fast-forward to the end, the departmental leaders were won over and the silos began to crumble. The organization was now united in its data management efforts, and the results spoke for themselves: increased revenue and improved efficiency.

But Sarah knew that the true victory was not in the numbers, but in the unity that had been achieved. She had cracked the code and brought order to the chaos. And just like the symbologist in one of her favorite novels, she had uncovered the hidden meaning in the data and revealed a path to a brighter future for the organization.

The Dan Brownesque narrative might not be exactly what you face in your daily work, but the facts are clear, your data scientists spend at least 60% of their time cleaning and organizing data, according to a survey by CrowdFlower published in Forbes.1 Furthermore, a McKinsey survey2 found that more than half of an analytics team’s time, including that of high-earning data scientists, is often spent on data processing and cleansing, hindering scalability and causing frustration among employees. This can negatively impact the productivity of individuals throughout the organization, where participants stated that approximately 30% of their overall enterprise time was wasted on unproductive tasks due to inadequate data quality and accessibility.

Where does it hurt?

Change initiatives aren’t performing as well as they could if data and information were easily available and understood. This is not solely a data issue, but the Democratization of Data is hindered by People, Process and Technology today. This is a paradigm that must change to accelerate Digital Transformation.

In some organizations, People guard their department’s data to ensure they maintain a knowledge edge against other departments, this is even more common in times of turmoil and cost cutting – exactly the time when an organization needs to work together.

Technology and software aren’t optimized to share data, it is optimized to perform a task or a workflow. Thus, sharing of data isn’t the key aspect when most software is developed. To solve this issue, organizations bring in additional technology such as Data Lakes and Data Warehouses which help store data but have difficulties in providing a human centric layer to interact with3.   

The democratization of data is a powerful tool that can help organizations make better decisions, improve efficiency, and drive growth. However, for data to be truly valuable, it must be accessible to all members of an organization, regardless of their role or level within the organization. This is where the concept of a common language and shared definitions becomes critical.

Without a common language for data and information, different departments, teams, and individuals may have different interpretations of the same data. This can lead to confusion, misunderstandings, and ultimately, a lack of trust in the data. For example, if the sales team is using one set of metrics to measure performance while the finance team is using another, it will be difficult for them to collaborate and make data-driven decisions.

A common language for data and information is essential for democratization to succeed. It ensures that everyone within an organization is speaking the same language when it comes to data and information.

This is particularly important when it comes to data governance and management. Without a common language, it becomes difficult for organizations to establish and maintain data governance policies, procedures, and standards.

So, a Rosetta stone?

A Rosetta stone for data is not just synonyms and translations between. But it is also the structure of data and information, how does one relate to another.

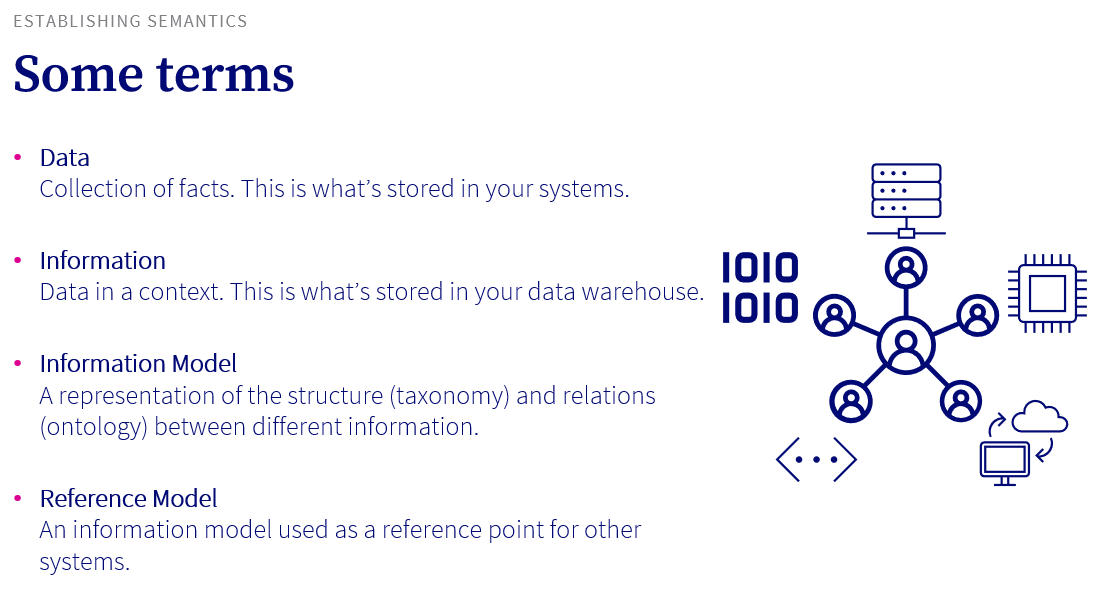
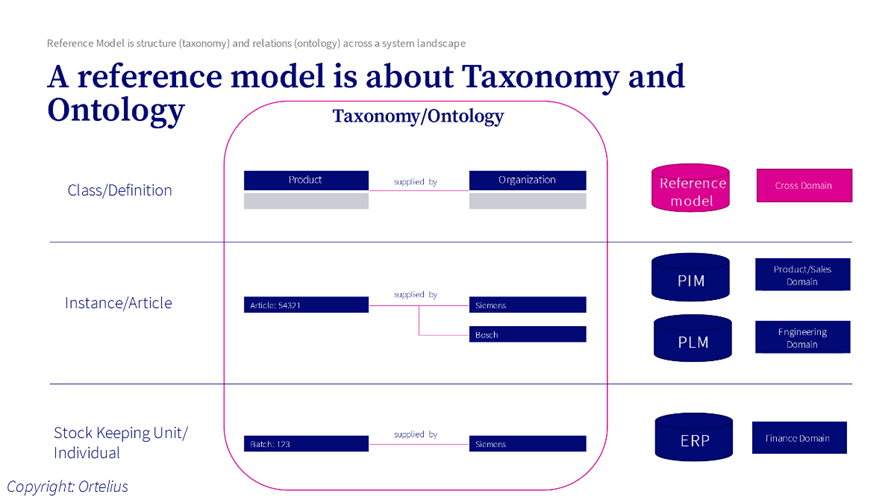
Let’s establish some terms to be able to elaborate on what a Rosetta Stone for data would mean:

Click on image to enlarge

In short, a Rosetta stone for data is a comprehensive system that would enable the organization to have a single source of truth and a common understanding of data across all systems, departments, and teams. It’s a way to ensure that everyone in the organization is speaking the same “language” when it comes to data, which makes it easier to share, analyze, and use data effectively.

The Rosetta stone approach needs Data together with its context (Information), structured and stored in a way that makes it easy to understand and use (the information model) built on a common reference model which is an information model used across many systems. This common reference model will be referred to as the Operational Reference Model from now on.

Part 2: Sounds great, now what?

How do organizations establish a common language for data and information?

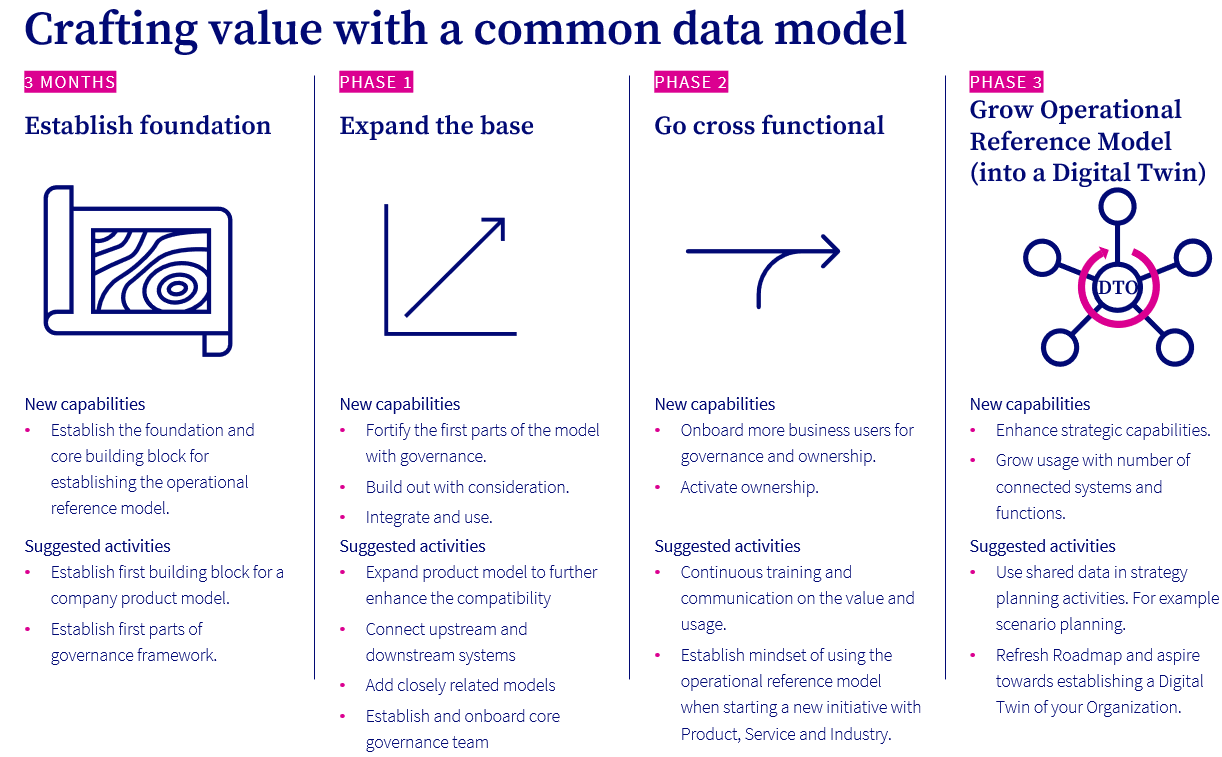
So, how do organizations establish a common language for data and information? One way to start is to build the first part of your Operational Reference Model that defines the types of data and the relationships between them. This will then provide you with the foundation for establishing your governance framework. The governance framework should include a set of policies, procedures, and standards that define how data is collected, stored, and shared.

Click on image to enlarge

Never try to establish a full common data model from start, always start with a burning platform

As you build it out, it will become your organization’s single source of truth for data and information, and enables users to discover, understand, and use data.

What about definitions?

In addition to a common language,  shared definitions are also essential for democratizing data. Shared definitions ensure that everyone within an organization understands the meaning and context of the data. They also ensure that data is used consistently and in a reliable manner.

Definitions can be stored in either a data catalog or a data dictionary which is using the Operational Reference Model to define the structure and relations between data. The data catalog should include data definitions, data lineage, data quality scores, data usage policies, and data access control policies. The data dictionary is a central repository of all data definitions within an organization. It enables users to understand the meaning and context of the data, and to use it in a consistent and reliable manner.

How did we get here in the first place? Didn’t we think this through?

The reasons are:

  • Technical debt arises from the use of different specialized business languages by various departments, making data sharing difficult.
  • Departments use data models and databases to capture and lock in their own business language, leading to multiple, disparate department-level databases that don’t communicate well with each other.
  • Accommodations and workarounds are made to connect the disparate systems, adding complexity, and contributing to the growth of technical debt.

To resolve this, you need to assemble a team of professionals to start working on this. Typically, you would create a group consisting of4:

  • Senior members of your organization who understand your business and how things are connected in the enterprise.
  • Skilled communicators who can easily communicate the concepts developed.
  • Change leaders who can lead and drive change and adoption in the organization.
  • Architects and technicians who can instantiate the resulting language into systems and the overall architecture.

Summarizing

The challenges organizations face with conflicting data definitions and a lack of a common language for data and information are bigger than what most Organizations would like to admit. We’ve introduced the concept of an Operational Reference Model which is the foundation for a “Rosetta stone for data,” i.e., a comprehensive system that would enable an organization to have a single source of truth and a common understanding of data across all systems, departments, and teams. The Rosetta stone approach includes data, information, an information model, and an Operational Reference Model. To establish a common language for data and information, we recommend building the first part of an Operational Reference Model that defines the types of data and the relationships between them, and using this as the foundation for establishing a governance framework that includes policies, procedures, and standards for data collection, storage, and sharing. The article also highlights the importance of shared definitions for data and suggests using a data catalog or data dictionary to store them.

In conclusion, the democratization of data requires a common language and shared definitions built on an Operational Reference Model. These concepts are essential for ensuring that everyone within an organization can understand and use data, regardless of their role or level within the organization. These tools and practices can help organizations establish a common language, shared definitions, and a single source of truth for data and information, which will ultimately lead to better data-driven decision making, improved efficiency and drive growth.

1: https://www.forbes.com/sites/gilpress/2016/03/23/data-preparation-most-time-consuming-least-enjoyable-data-science-task-survey-says/#437d25337f75

2: https://www.mckinsey.com/capabilities/mckinsey-digital/our-insights/designing-data-governance-that-delivers-value

3: https://hbr.org/2016/12/breaking-down-data-silos

4: https://hbr.org/2021/12/effective-digital-transformation-relies-on-a-shared-language

/Daniel Lundin, Head of Product & Services
Daniel Lundin Ortelius digital twin


Doing carbon transparency right – here’s how

Publicerad: 11 January, 2023 av Alexandra Jerrebro |

In 2019, Emma walked towards the meeting room that she had booked for the entire day. She only had one point on the agenda:

  • Environmental Goal 2030 – Enabling our customers to be carbon neutral

“There is a high risk that we spend the entire day just discussing and we won’t get any closer to any type of action”, she thought as she entered the room. A few of her colleagues stood by the pastries and sipped coffee discussing a particular customer challenge they were working on.

“This is the third major customer this quarter who’s been requesting more granularity in traceability and carbon footprint. We’re already ahead of our competitors in carbon emission data, how can they still ask for more?”

Emma joined the conversation, “What if we did something bold, what if we had full transparency from cradle-to-cradle. Feedstock, transportation, processing, distribution, recycling – the works?”.

“It’s impossible to be that granular”, another colleague pitched in immediately.

“In this room we have some of our best experts in purchasing, supply chain and processing. Are you saying that we have a challenge in front of us that we’re not able to solve as a group”, Emma challenged him.

“Let’s begin the meeting”, Emma then announced and quickly started the meeting with this slide.

What is your biggest hairiest problem?

When I start working with my clients, I ask them:

“What’s your biggest hairiest problem?”

The answer might be something like this:

“We want to create full carbon transparency end-to-end for our products. But it’s impossible.”

My follow up question is:

“What data, information and knowledge do you need to solve this problem?”

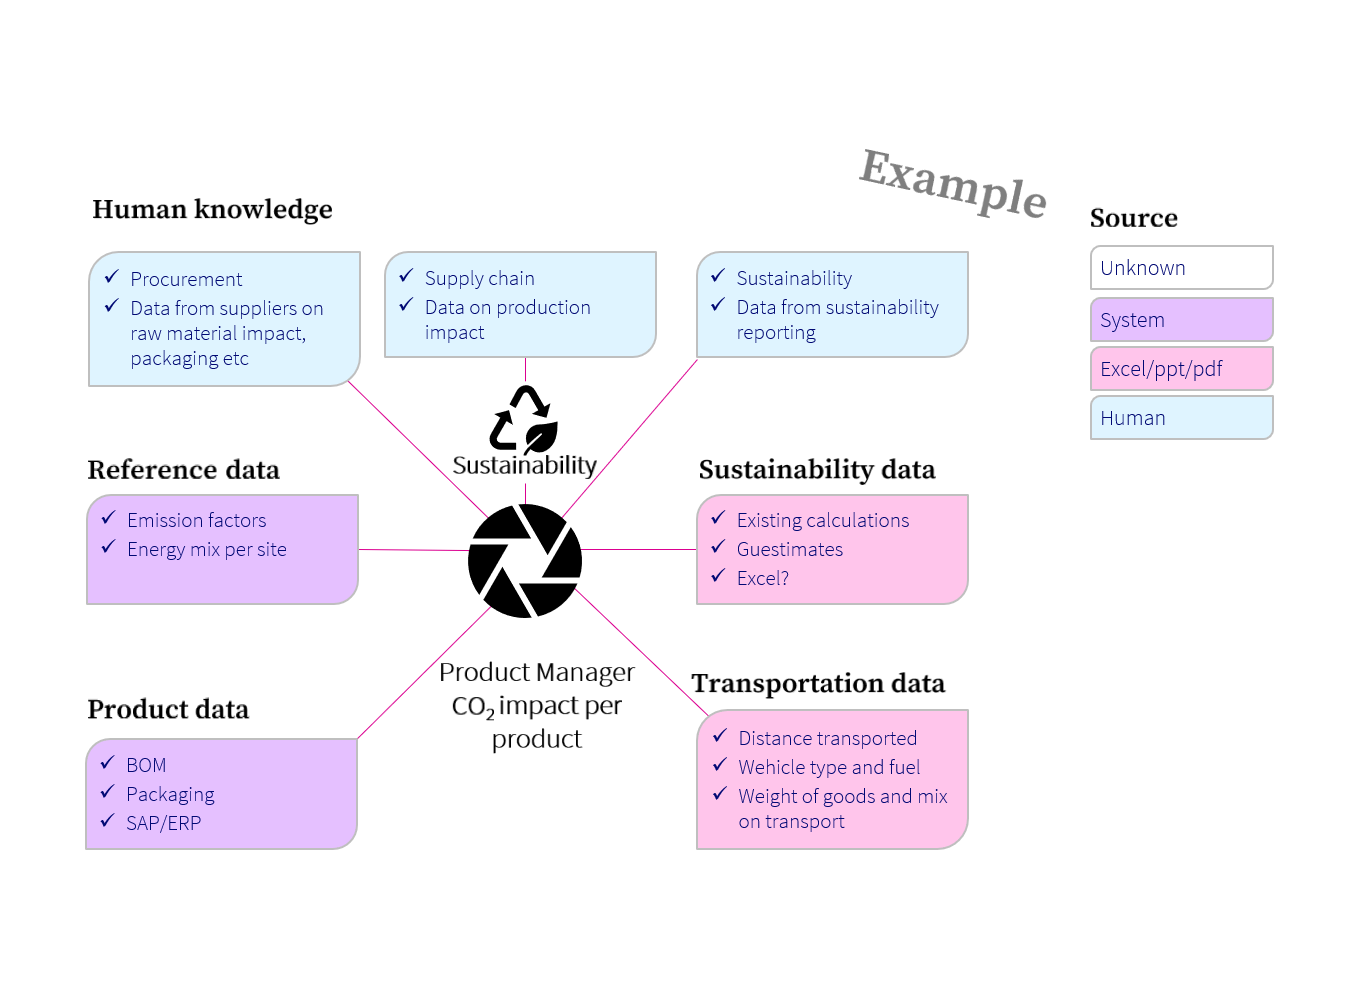
“I need to know the carbon footprint for each type of feedstock, which is something our suppliers don’t have. I need to have traceability of feedstock throughout our enrichment processes, something which we can’t do. I need to know what the carbon footprint for transportation across 5 continents with 100s of transportation companies. I need to know the energy usage for the processing of groups of feedstock in combination with the local site energy mix. We have none of this today. I don’t even know where to start.”

Narrowing it down

Let’s break down the situation in its individual pieces.

For this specific case, we need to create a data model which supports the following:

  • Feedstock Types
  • Relation between Feedstock Types and Product
  • Product
  • Transportation Methods
  • Relation between Transportation Methods and Feedstock Types and/or Product
  • Organization
  • Relation between Transportation and Organization
  • Production process
  • Relation between Production Process and Feedstock and Product
  • Relation between Organization and Organization through a Business Party relation
  • Business Party
  • Geography
  • Relation between Production process and Geography
Figure 1: All of these elements need to be able to hold CO2 emission values. Feedstock and Production process can be reused to model the Energy Mix for an individual site.

(Click on image to enlarge)

Get to work

Once you’ve narrowed down the issue in its individual parts, it’s time to get to work.

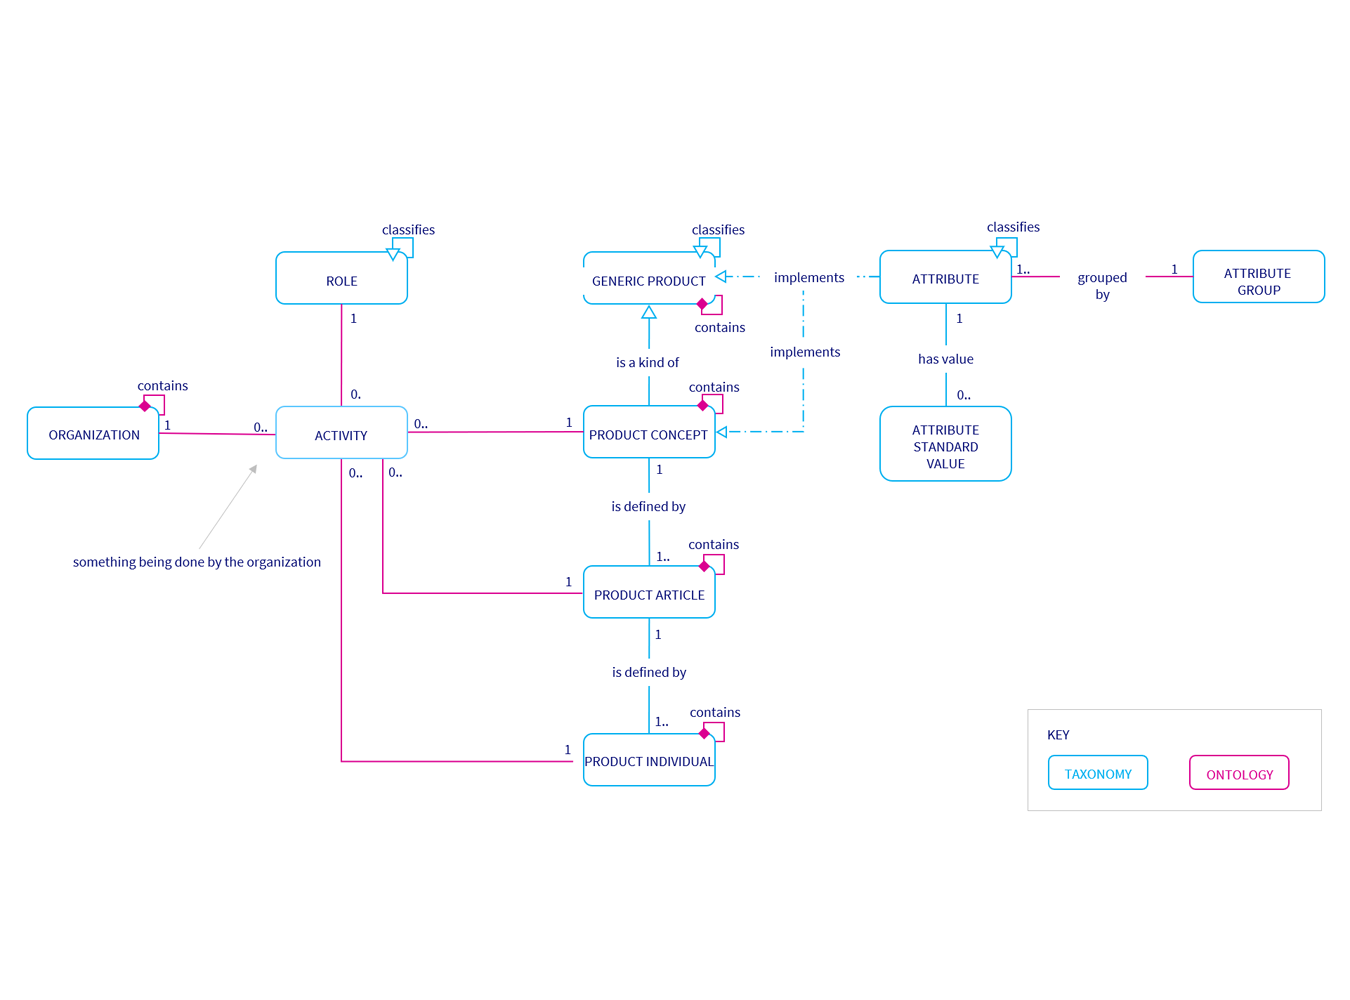
A typical Product Model looks like this. It says that (reading from bottom to top):

  • A Product Individual (has its own serial number, can be bought by a customer) can consist of another Product Individual.
  • A Product Individual is related to a Product Article. A Product Individual is a produced based on the Product Article’s specification. The Product Article’s MBOM creates the first Bill of Material for the individual but then the individual follows its own lifecycle, i.e. it may get new parts with new capabilities.
  • A Product Article is the specification of the Product. It holds all the attribute values for the product. Product Article is what is specified by engineering (EBOM – As Specified) and what is produced by the factory (MBOM – As Built).
  • A Product Article (shares an article number with other Product Articles but is not an individual product which a customer can buy).
  • A Product Article is related to a Product Concept and to a combination of Organization and Role.
  • A Product Concept is a Generic Variation of a Product.
  • A Product Concept is a generic description of the product which is stable over time even if a new version of a Product Article is released under a new article number.
  • A Product Concept is related to a combination of Organization and Role.
  • Generic Product is the master classification structure which holds the definition of which Attributes are defined for each Product. 
Base Model: Product
Figure 2: Base Model: Product

(Click on image to enlarge)

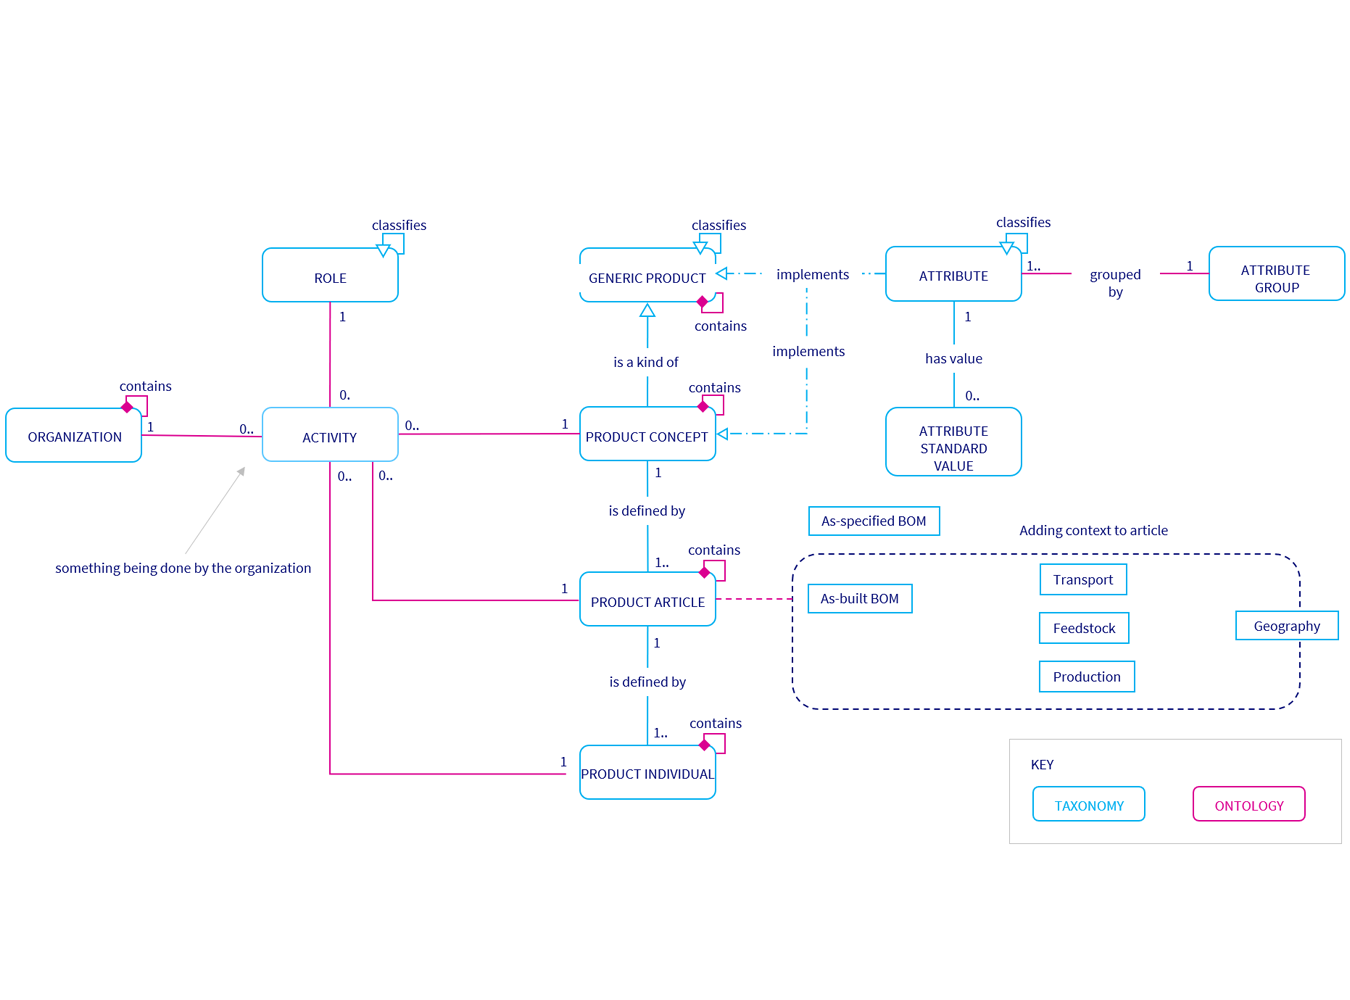
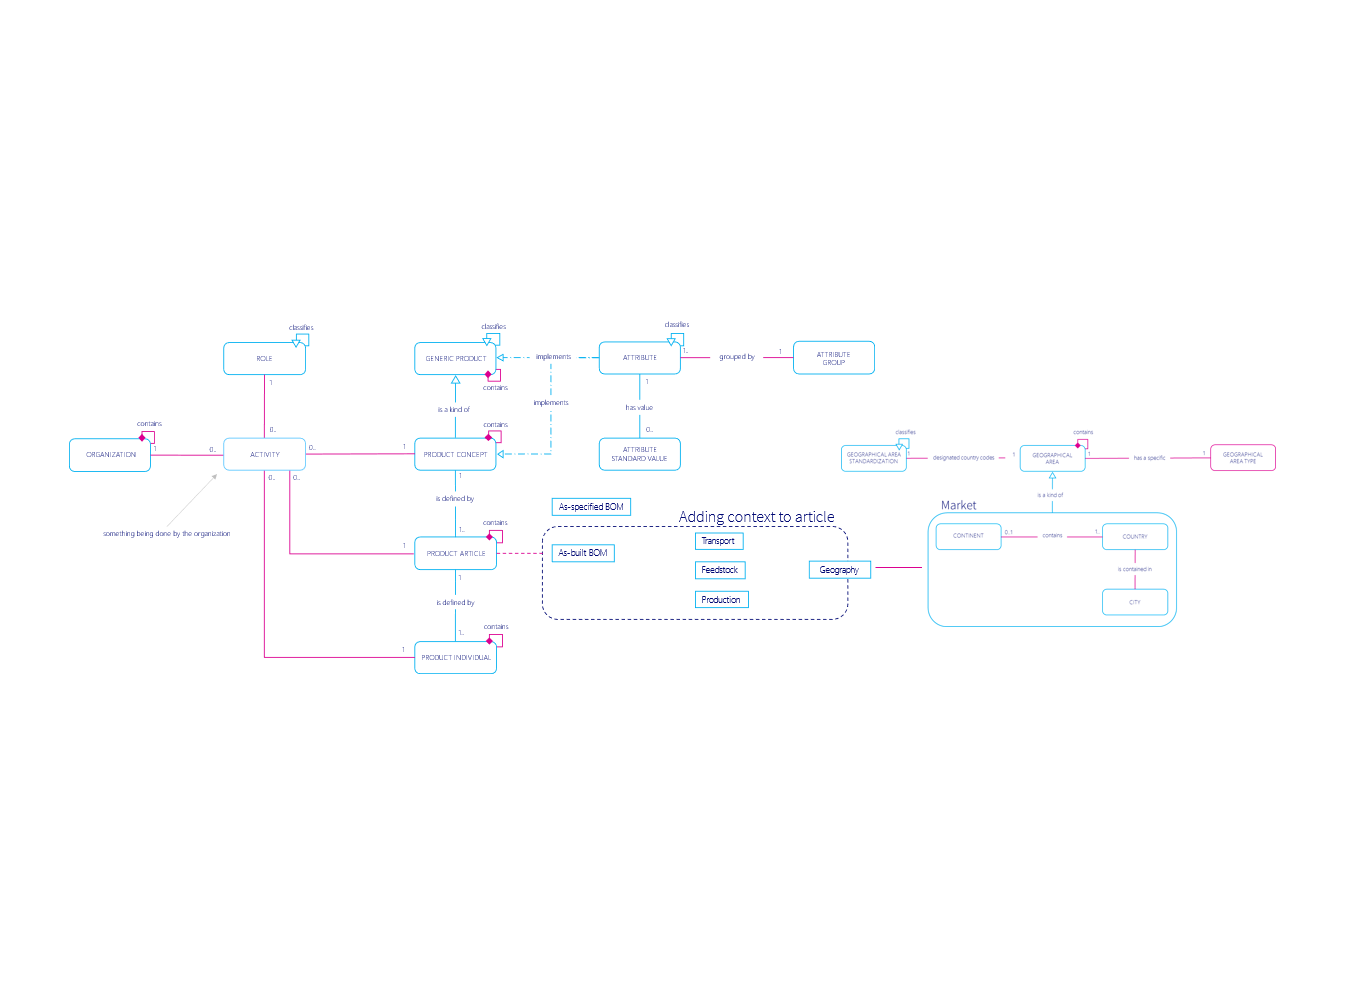
The key in solving complex data issues is to build out the data models step by step whilst ensuring connectivity to other data models. To capture Carbon Emissions the product model was extended on the article level to capture the as-built BOM.

Click on images to enlarge


The model is continuously evolved, expanded and tested. Ensuring that use cases and data match are supported by the model.

An Operational Reference Model

Carbon Transparency is no different. Once you have the data models defined, it’s necessary to visualize, validate and improve the data models with actual data. This is the core of what we expect from a Digital Twin Platform. This increases the demands on a data model as it needs to be live, executable and populated with real data. I call it the Operational Reference Model. If this is achieved, it will support the following functions:

  • Centralized and distributed governance
    • Support both centralized and distributed governance of meta and master data.
  • Connectivity
    • Be agile in its relation to existing solutions, to supports both existing meta and master data management solutions as well as covering gaps in those systems.
  • Hold and maintain Taxonomy and ontology for increased data quality
    • Taxonomy and Ontology are key elements for creating the necessary context for any AI and ML initiative. A platform designed to build, maintain and distribute taxonomies.
  • Active meta data management
    • To manage and maintain simple-to-complex meta data which is used in PLM, ERP, CRM, PIM, PDM and MDM as a common language for data exchange.

New capabilities

Going back to Emma, what happened after her full day working meeting?

She had an ace up her sleeve, as she already had an Operational Reference Model in place for Product which gave her a head start. Before the end of the year, she was able to deliver new capabilities to the organization:

  • Supporting the business with environmental information to be able to give correct information to customers.
  • Supporting the consumer demands connected to environmental information.
  • Be able to simulate (future demands on) product configuration in an environmentally friendly way.

 The 2030 vision that seemed impossible at first, was now perceived as achievable. One step at a time.  The requirements were in place, the roadmap to achieve it was set. Suppliers were informed of data requirement ramp-up the coming years. The key was envisioning the future, taking a future back mindset, and going backwards to define what is necessary today.

To do carbon transparency right is possible. What happens if you don’t do it – for your own organization or your customers?

/Daniel Lundin, Head of Product & Services
Daniel Lundin Ortelius digital twin


If you had to do a Football World Championship 2.0 model

Publicerad: 14 December, 2022 av Alexandra Jerrebro |

An information modeler’s challenge – how would you have done it?

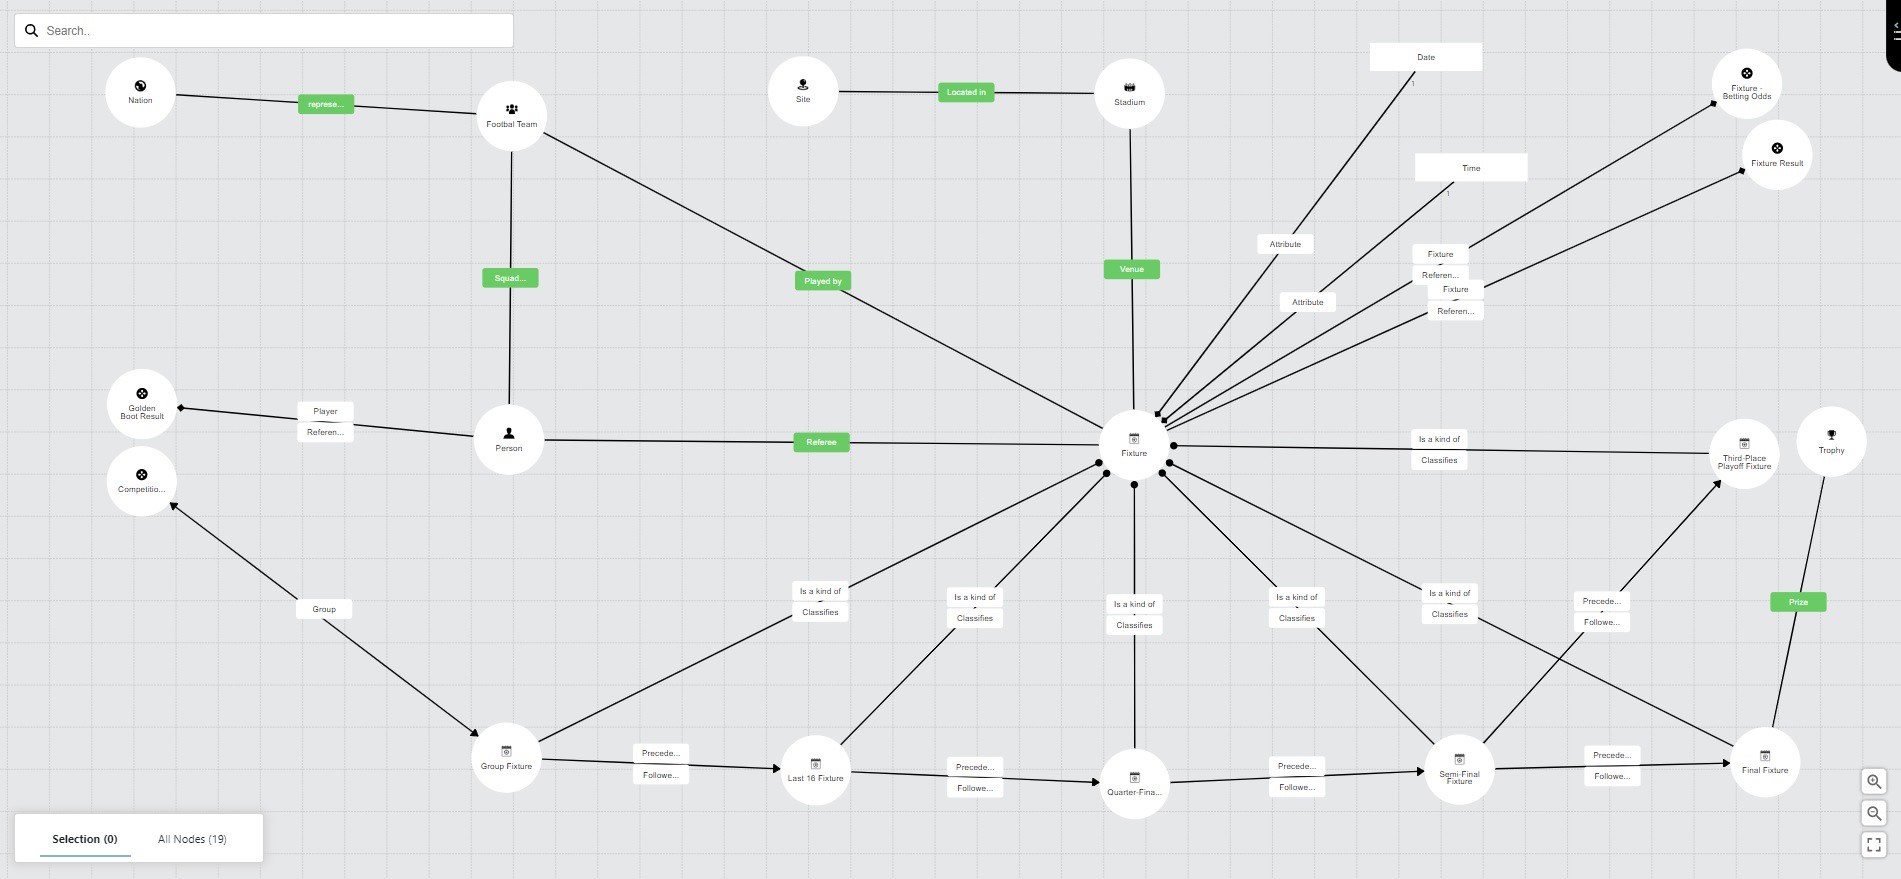
How is a Football World Championship really structured and what are the components required to make up the whole? Football associations, national teams, players, referees, coaches, equipment, assets such as stadiums and not least the games themselves. So, what to do with a challenge like the Football World Championship? A question the international governing body (with whom Ortelius has no commercial association) have asked and answered with, at best, mixed results in recent years. It is also a question that we at Ortelius found ourselves standing in front of a few weeks ago, at least from an information modelling point of view.

Like most workplaces, we like to have a football prediction competition during major championships. However, being information modellers, we could not resist the temptation of stretching the parameters of our competition. Could we model a football competition and break it down into it parts? And even better, could we build a model that would be sustainable enough to extend to other competitions and live into the future? After all, this is something we do for every major championship.

But where to begin? An issue which confronts us not just in the case of this model, but in any model for which we start with a blank canvas. The problem with the sky being the limit is that the sky is intimidatingly big, and a limit, initially at least, would often be quite welcome. We address this by defining a use case against which we can develop our model. What is key to remember here is that the model is not only built to solve this use case, but rather the use case gives us a frame against which to set the scope of our model. We need to define all the entities needed to solve our problem and provide immediate value, but we want to do this in such a way that those same entities can be used when additional use cases come.

Our initial use case was of course our prediction competition. In our competition at work, all competitors would predict the results of all games and would receive points for guessing the correct result with bonus points for guessing exact scores and correct goal difference. To achieve this, we would need to model the teams to compete in the games, the games themselves, their results, and the groups and knock-out formats in which the games would occur.

Figure 1: Draft of information model

(Click on image to enlarge)

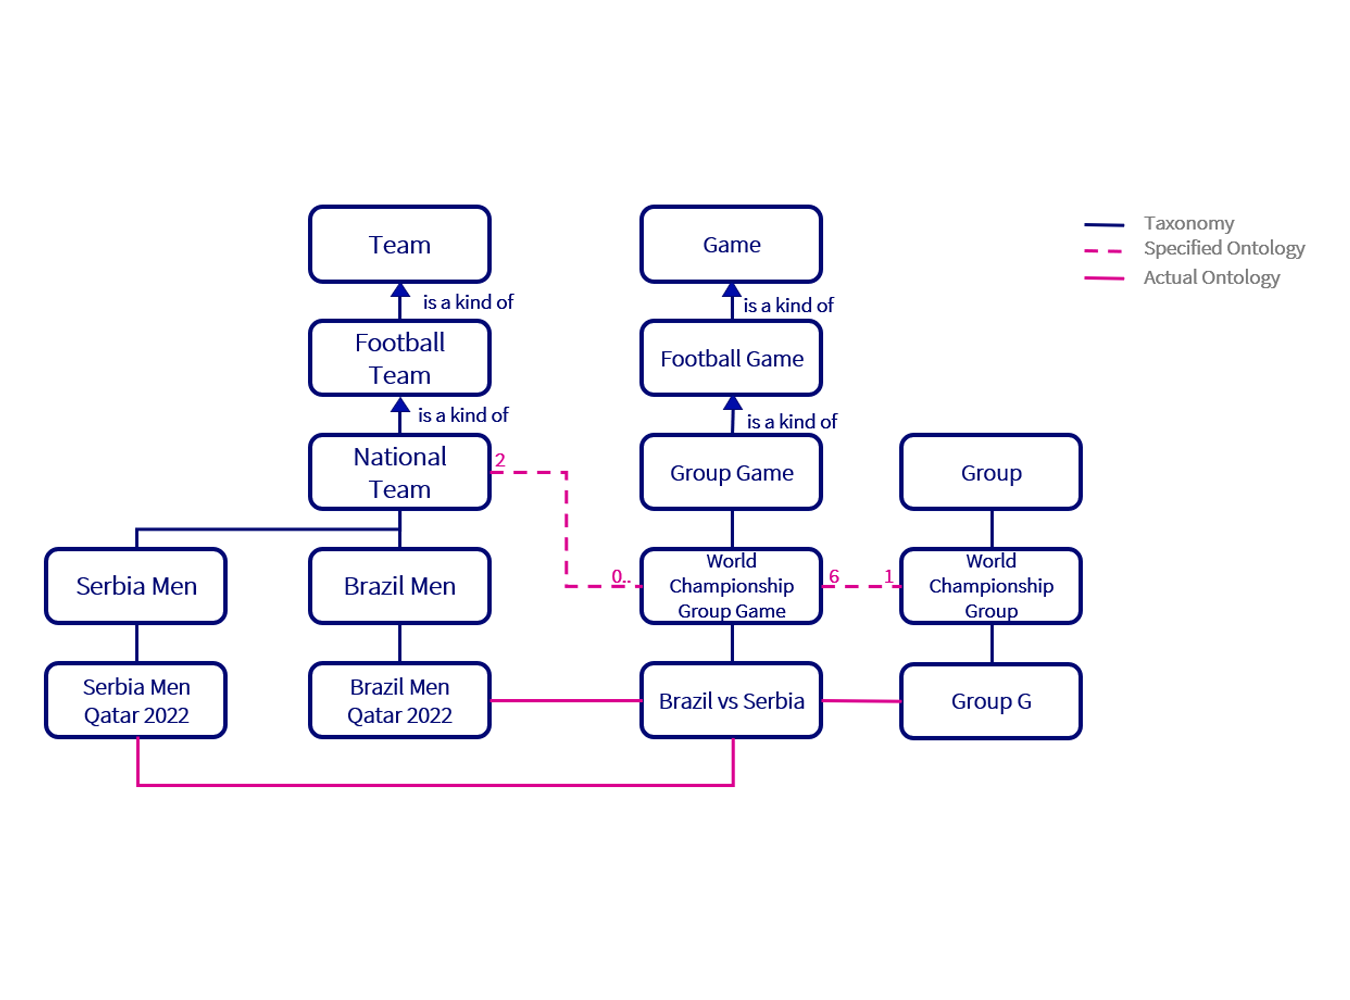
Our first step is always defining the taxonomies in our model. Creating detailed taxonomies allows us to create a surrounding ontology with connections at the right level. We can use our definition of team as an initial example. Brazil is an iconic and enduring presence in world football but current team of Neymar and Richarlison is not the same entity as the team of Rivaldo and Ronaldo. This is also the Men’s Football World Championship; Brazil has a Women’s team which would also need to be supported by this model in the future. Remember, we are building a model not only to solve our current use case but future use cases too.

In addition, Brazil is a national team with a very distinct ontology from a club team. It competes in international competitions against other national teams rather than in a domestic league against other clubs. From this, our taxonomy emerges distinguishing first between football teams and, for example, rugby teams and then branching out with club and national teams. We can then create our variants of national team such as Senior Men and Senior Women. Finally, we can create our individual teams based on these variants such as the current Brazil squad containing Neymar and Richarlison. The current Brazil squad can be connected to the Qatar Football World Championship while the concept of the Brazil national team can be connected to the Brazilian Football Association. This may seem self-evident in this case but a poorly defined taxonomies can be found at the root of a substantial number of data problems.

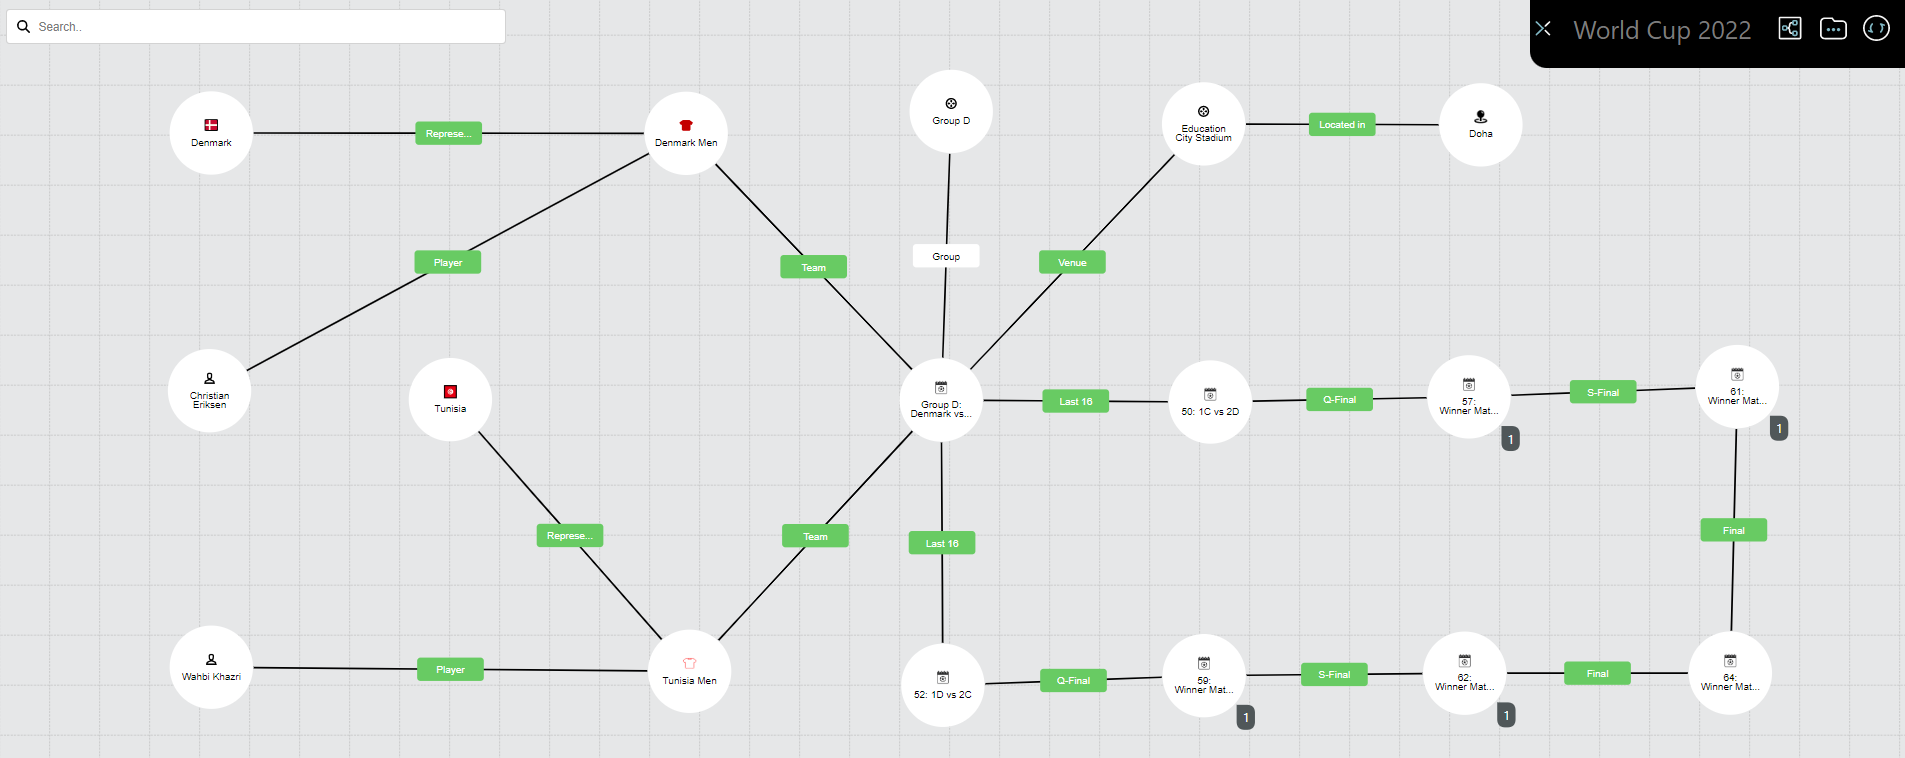
The next challenge was to define a game of football. Our starting point was to try to define it as we would any activity such as a task or manufacturing process. A game has a defined length in time, resources (players, officials, stewards, etc.), equipment (goals, footballs, cameras), an output (a result), and location (stadium). We developed our game taxonomy to differentiate between football games and other sporting games as this gives us a frame to differentiate in terms of attributes such as game length, but also a clear structure with which to connect our football games to their wider ontology. For example, group games are 90 mins and included in a group while a quarterfinal will have the potential for extra-time and penalties and will be followed by a semi-final. We can then begin our ontology work by connecting the teams we defined as a resource which enable the game much like we would connect a machine to a manufacturing process. There is a certain satisfaction in using modelling concepts that you would usually use to model a production line in a factory to solve the problem of France vs Tunisia.

Figure 2: Information model in application

(Click on image to enlarge)

We then continued our taxonomy work defining groups and how they relate to teams and the competition as a whole. A proposal has been floated to reduce the groups to three teams in 2026 and expanding the competition to 48 teams so the nature of this taxonomy and ontology could change significantly in the future. And finally, we have our predictions. The games have an actual result of course but it is important to capture our competitors’ predictions. Again, this is much like any activity model with a forecasted and actual result.

We are now coming to the end of our competition and by populating and testing our model with data we have learned a lot about its strengths and weaknesses. Our taxonomies could do with some refining to allow better inheritance for both teams and games but that is the nature of taxonomies, they are never truly complete and need to have the flexibility to be evolved based on testing and new information.

The real challenge will come with the next tournament with which we want to test the model and we will see if it is resilient enough to embrace that one as well, but for now we should get back to doing some actual work.

(Click on images to enlarge)

Figure 3: Information model in application

Figure 5: Example of Group Tables

Figure 6: Dynamic digital model made in inorigo

/Ferdia Kehoe, Senior Information Modeler


A new breed of business consultants of 2023 will know data and information modeling

Publicerad: 7 December, 2022 av Alexandra Jerrebro |

Let’s start with a couple of questions to set the scene.

  1. Do you believe data and information are important parts of developing your business?
  2. Do you believe that decisions you make today will have an impact on the success of your business tomorrow?
  3. What are the first steps when you start developing a new product?

As a business consultant you are often faced with a wide array of tasks and topics. Many (most) include data in one form or another. Increased specialization and the drive to aggregate expertise, assign accountability and providing a sense of identity have led to increasingly siloed organizations, as discussed in the November issues 2021 of Harvard Business Review, HBR1. Organizations are adopting different methodologies (e.g., SAFe Agile, Hub and Spoke, Teal organization) to manage this and increase knowledge sharing. Increased knowledge sharing across silos enables employees to sell more and learn more.2

This brings us back to the question of the new breed of business consultants and their knowledge of data and information modeling. Can they help companies in sharing information across silos, enable growth and boost learning? And how can a business consultant provide a framework for knowledge sharing in a way which makes sense to the recipient?

A new breed of business consultants works with these questions and think differently. Consider following statements in relation to the questions previously asked.

  1. When you develop your business and its capabilities you should ensure that data and information are developed and structured together with the business.
  2. What data model you create today affects what generates the data and information that you need to make decisions on in the future.
  3. When you start developing a new product or construct a new building you often start with an architect/designer because they are able to design and visualize the result. This in turn ensures that everyone is aligned on the result before you start. The same goes for data and information when you work with strategic decisions changes in your organization.

If you want to ensure that all new capabilities will generate data which forms the foundation for your ability to gain insights, share knowledge and increase sales in the future, you will need to design your data model alongside your operating model. Or rather, as a part of your operating model.

To be clear, a data model in Excel only takes you to base camp. It’s a great starting point, but you will require additional skills and preparation to reach the summit.

One way of considering the role of a data model in the everyday life of a business consultant is talking about semantics. Revenue and Product are two terms often used when you work with a business consultant. But are we entirely clear on what aspects of a product the person we talk to use?

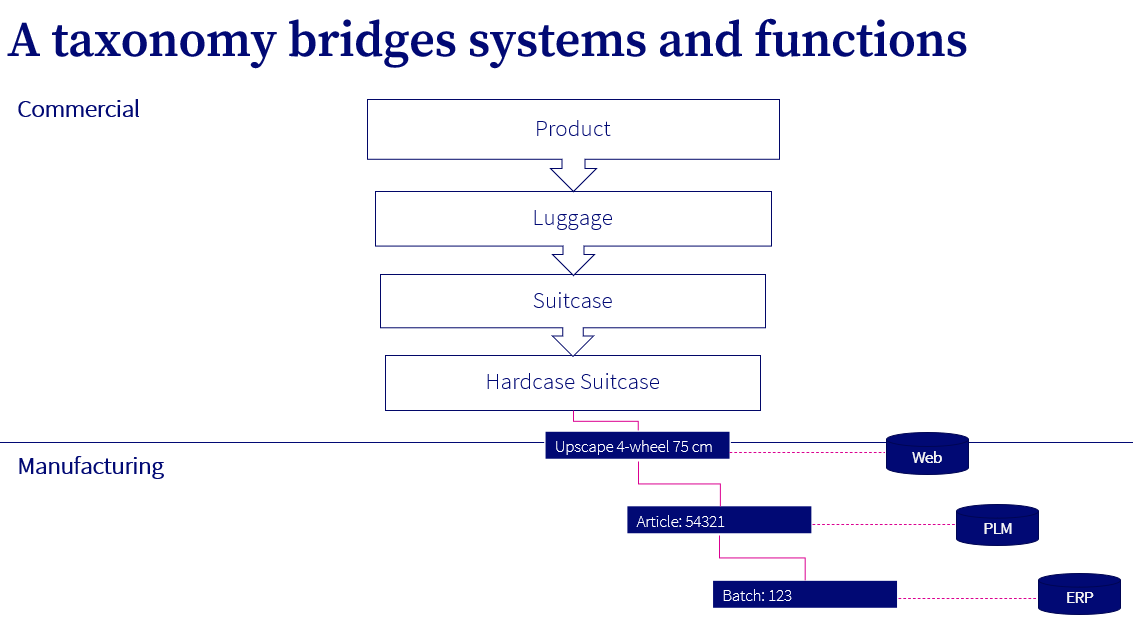
A bigger question here is: Do we talk about a Product from an Engineering, Financial or Sales perspective? For products, a Taxonomy (a logical, hierarchical structure) and an Ontology (how a Product and an Organization are connected) provides a way of establishing a language where it’s clear what context we are operating in.  

Figure 1: Different levels of Product and functions in an organization

(Click on image to enlarge)

Taxonomy and Ontology are the two primary tools in the information modeling workbench that propel a business consultant close to the summit – and consequently close to summit for the customer. They allow people and functions to understand the relation between themselves. Once established, it allows data to be structured and used cross functional. A Taxonomy and Ontology works independently of systems, whilst still enhancing the capabilities of individual systems. It supports processes and provides clarity in what data and information is enriched and maintained in each step of the process. A taxonomy gives a solid framework for business, process and data to work jointly.

Well designed and put in operation, it will ensure ultimate adaptability for an organization who want to evolve over time!

Figure 2: A taxonomy allows for common understanding of the different aspects of a Product

(Click on image to enlarge)

An example of this is a large manufacturing company which we at Ortelius work with. In one case, the customer was about to launch their first eBusiness solution, but they had two major concerns that caused inefficiency. 1) There was no single source of truth for their products, one and the same product could have up to seven different names depending on who you spoke to in the organization, 2) They wanted to be customer centric and thus not create an eBusiness solution based on their internal article number database (2.5 million sales items). Together with the customer, a Product Taxonomy was developed and designed outside in (“how does the world and our customers see the products we produce”-perspective) and created a single source of truth for a commercial product offering. The commercial Product Taxonomy then had relations to one or several articles rendering the ability to sell and market the same article under different names/brands in all customer facing channels without creating data redundancy across the entire data landscape. Once this was in place it was easy to start building knowledge around the products. Marketing, Sales, Patent/Trademark, Operations, Supply, Service and Product Management all had different needs on product information, but also product information from other departments. The solution enabled Service to automatically obtain information from Sales about which industries and markets the product was sold in – this improved insights and customer service efficiency, Product Management obtained information from Patent department about which products had IP protection – this minimized business risk, Marketing obtained information from Product Management about which translations were approved – this improved sales channel efficiency and time to market.

Traditional Business Consulting consists of gathering data and information, collating it and presenting it and/or implementing it to improve efficiency or increase sales for a customer. The work on structuring data and information is being done anyways, but customers are beginning to ask for more than a PowerPoint or Excel delivery. Customers are asking for a sustainable, governable way of solidifying the work already done. If the data model is created, why not take it from base camp to the summit and ensure the customers receive the value they need. This is the role of Business Consultants 2023 and onwards.

/Daniel Lundin, Head of Product & Services
Daniel Lundin Ortelius digital twin


Sources:
1. https://hbr.org/2021/11/making-silos-work-for-your-organization
2. https://hbr.org/2019/05/cross-silo-leadership


The puzzling truth of Composable Business

Publicerad: 17 November, 2022 av Alexandra Jerrebro |

and how to get it all right – piece by piece

The golden future of composable business

So, what is composable business? In short, it is about going from a rigorous and monolithic system landscape to a modular application portfolio. By arranging and rearranging digital solutions of business components, organizations are assumed to achieve flexibility and agility in the age of digitalization. According to Gartner, who reinvented the concept, organizations will significantly improve their recognition, agility, resilience and leadership skills. This great idea is about building an organization made from interchangeable building blocks. However, the suggested implementation approach will hardly be able to deliver what it promises. It is by no means as rational as it sounds. In fact, it will most likely have the opposite effect.

Fill in the form to download the white paper

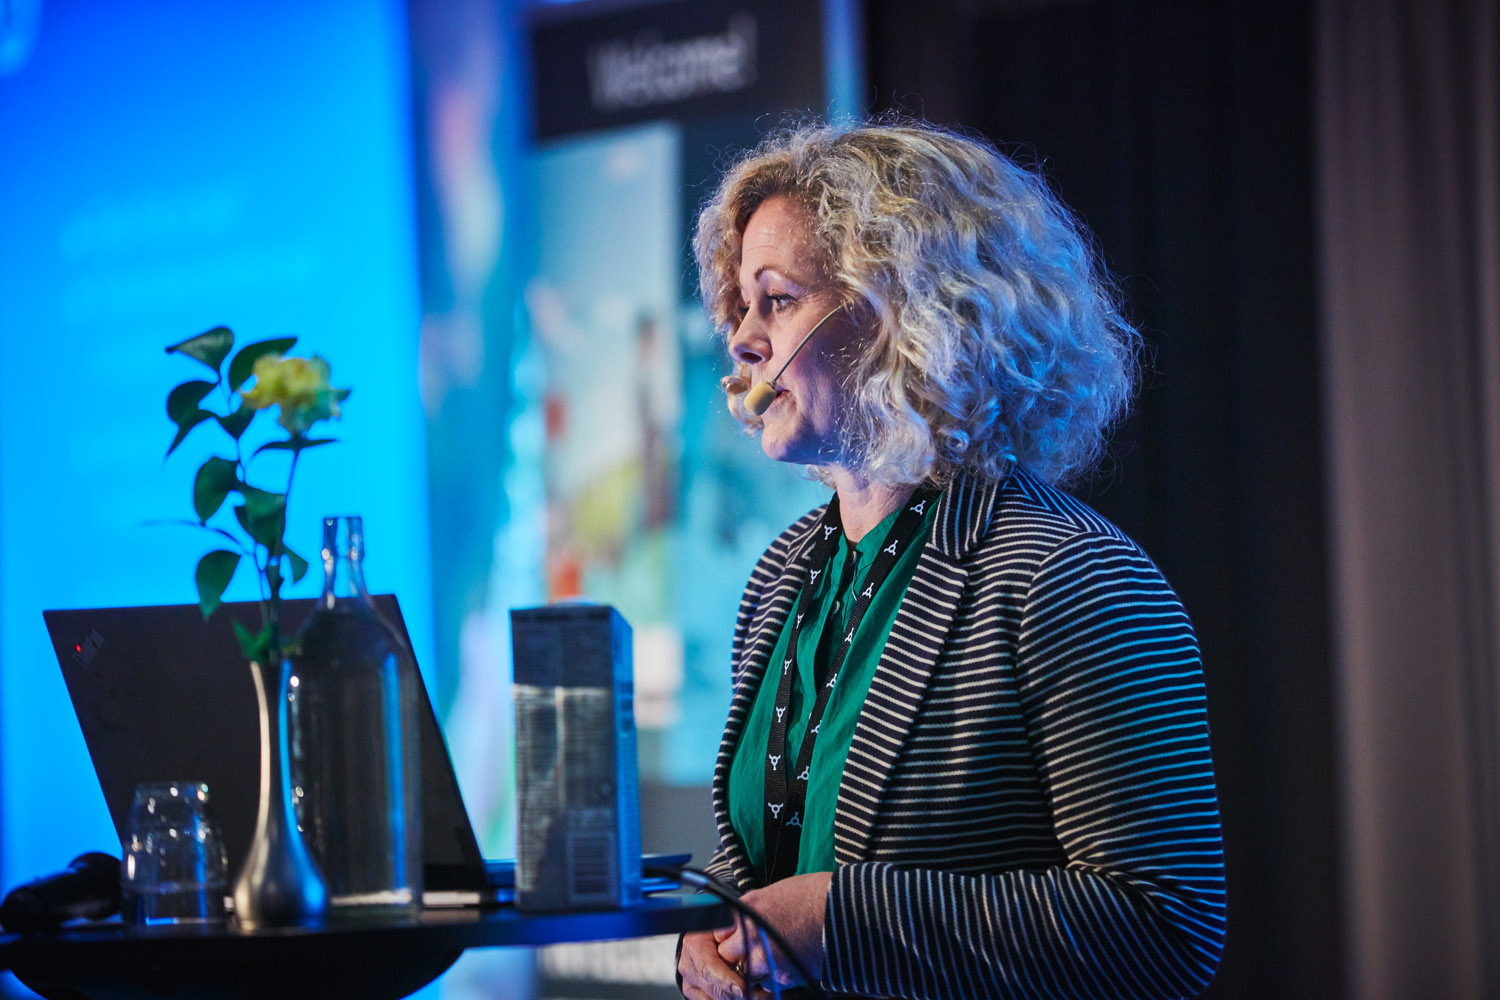
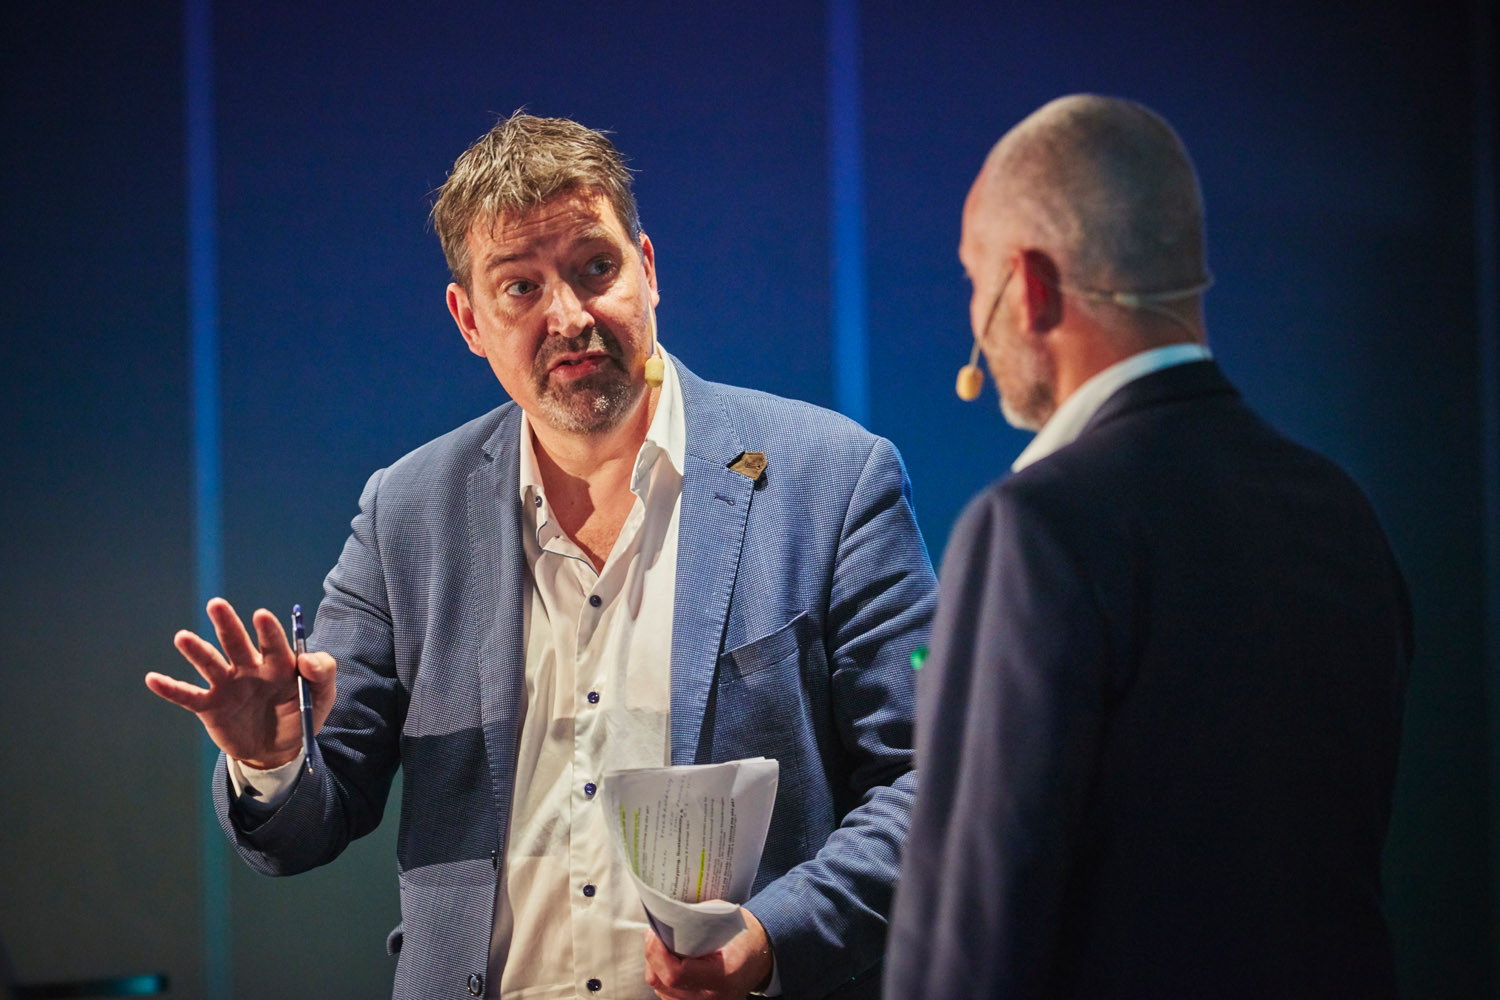
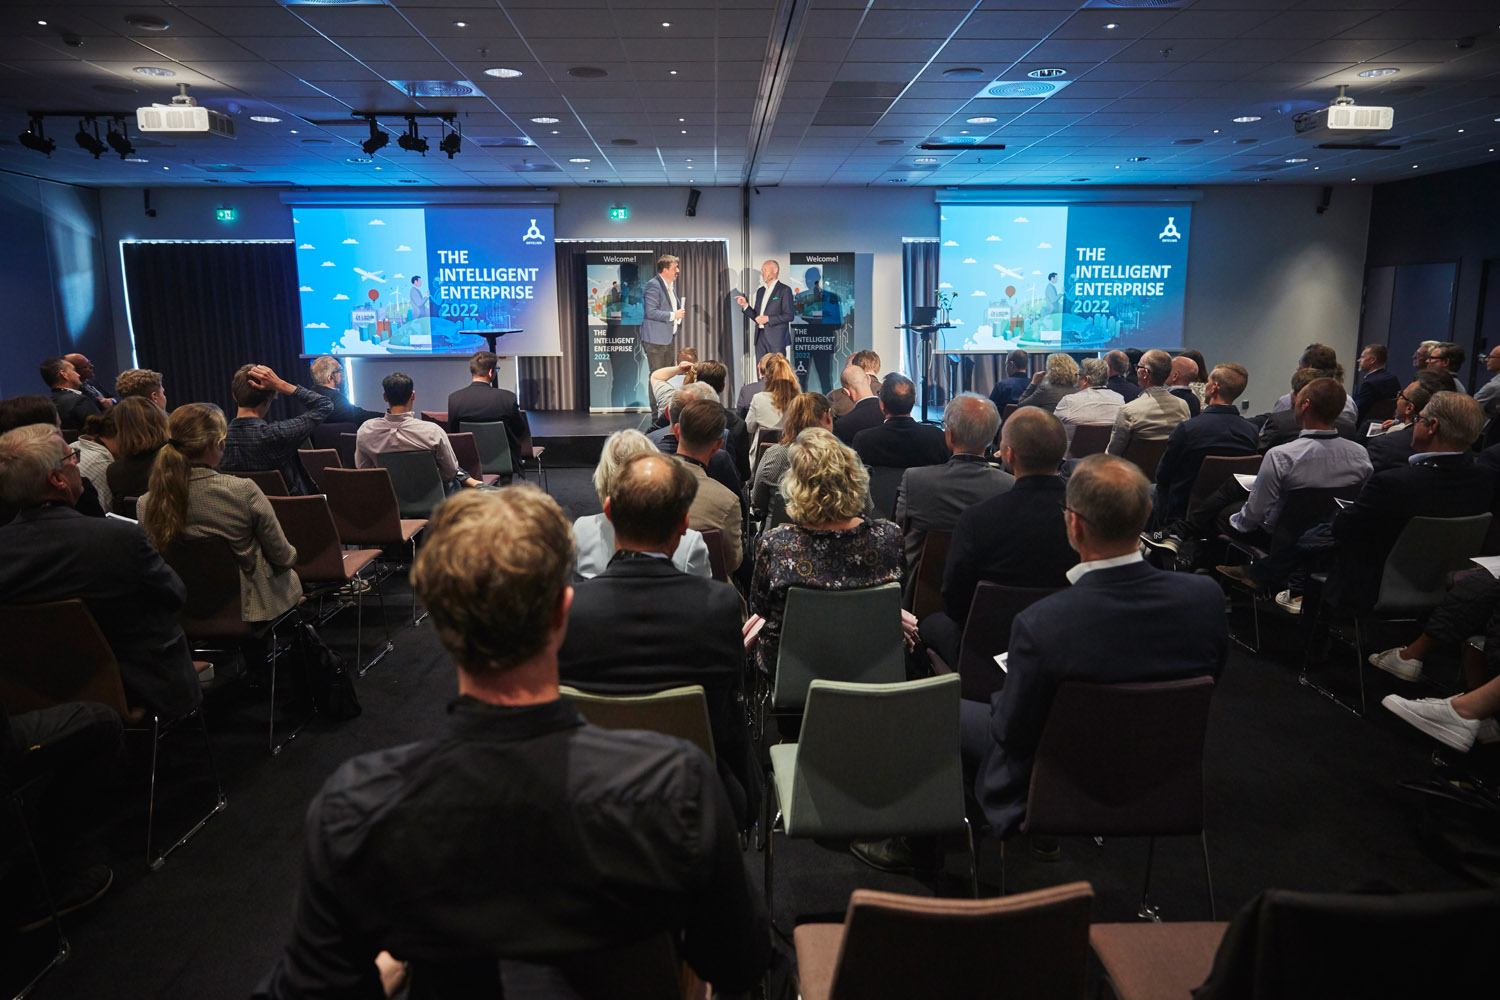
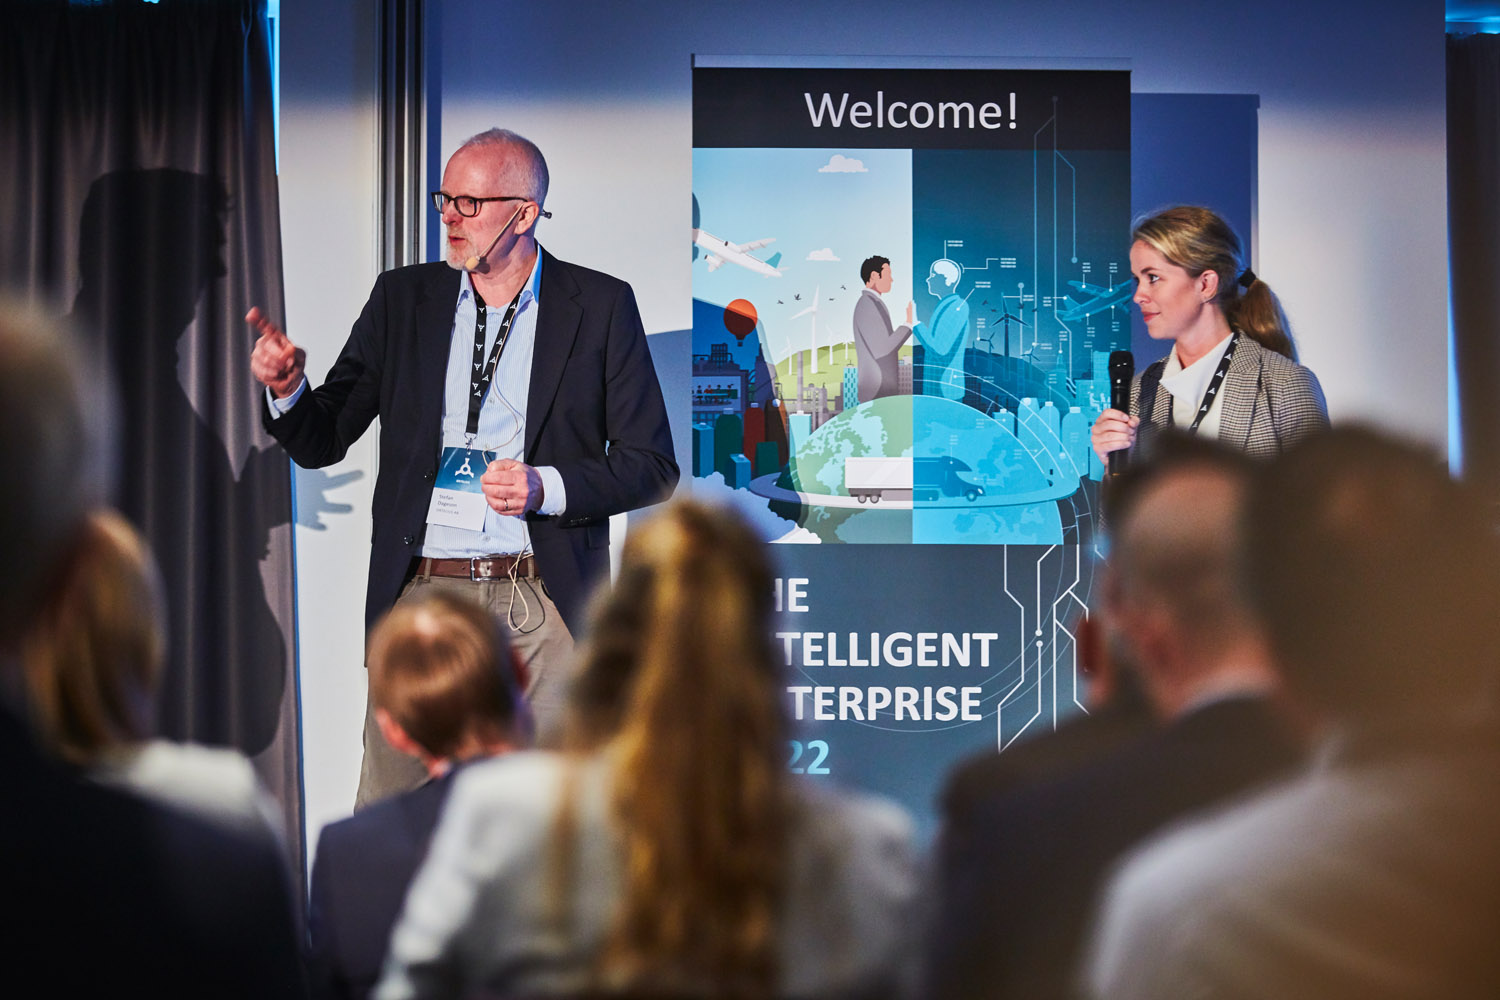
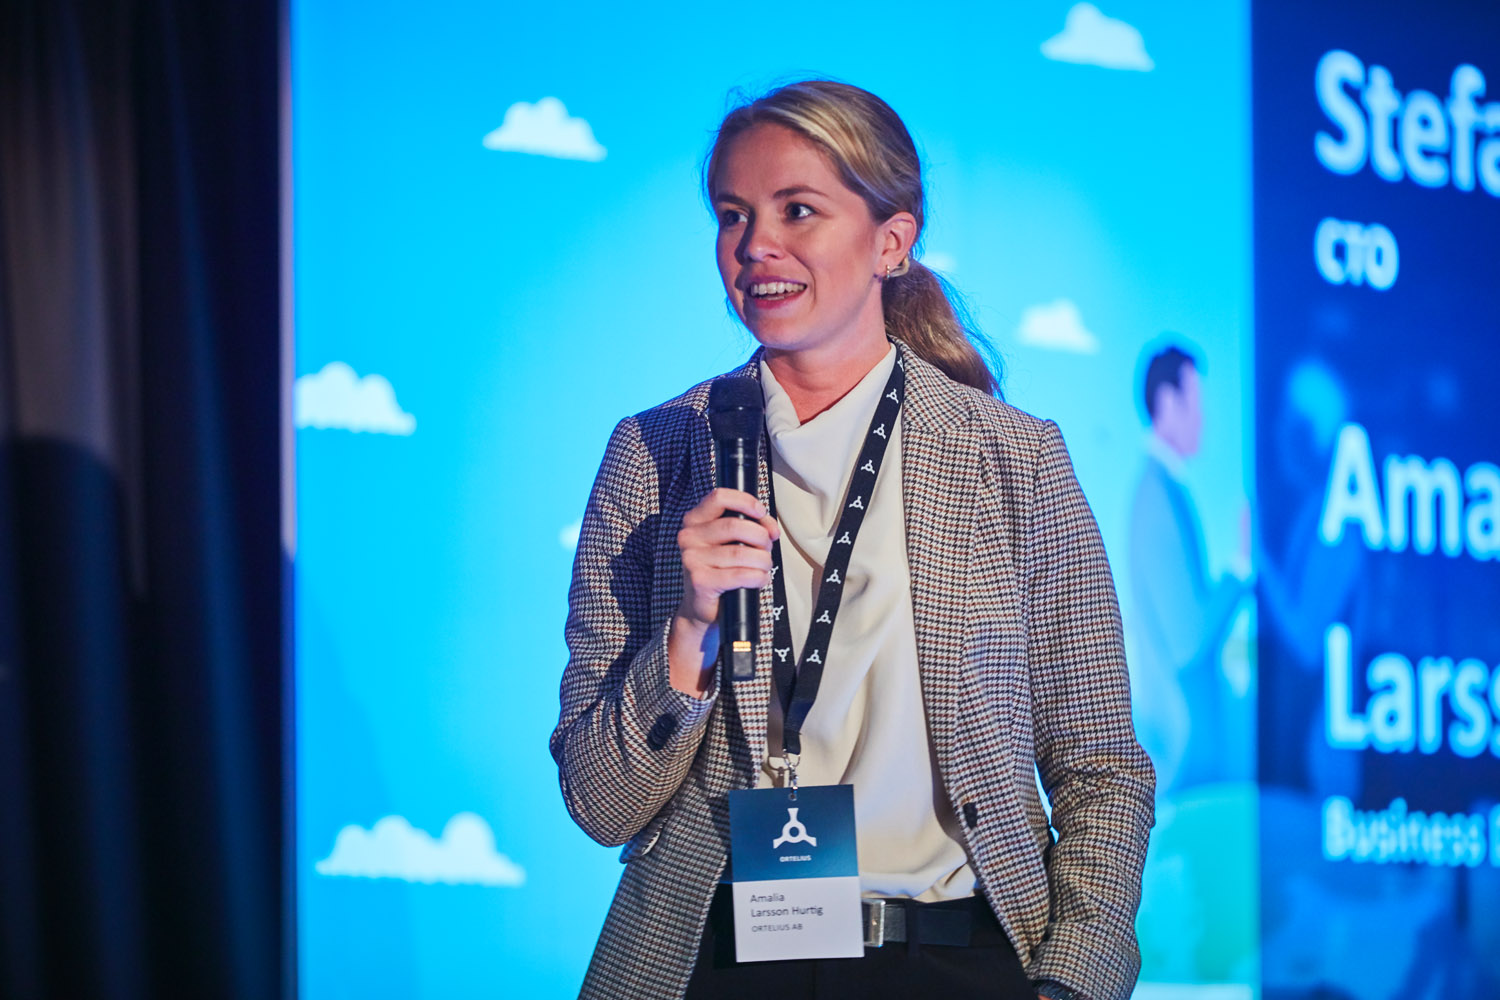
The Intelligent Enterprise – May 19, 2022

Publicerad: 19 September, 2022 av Alexandra Jerrebro |

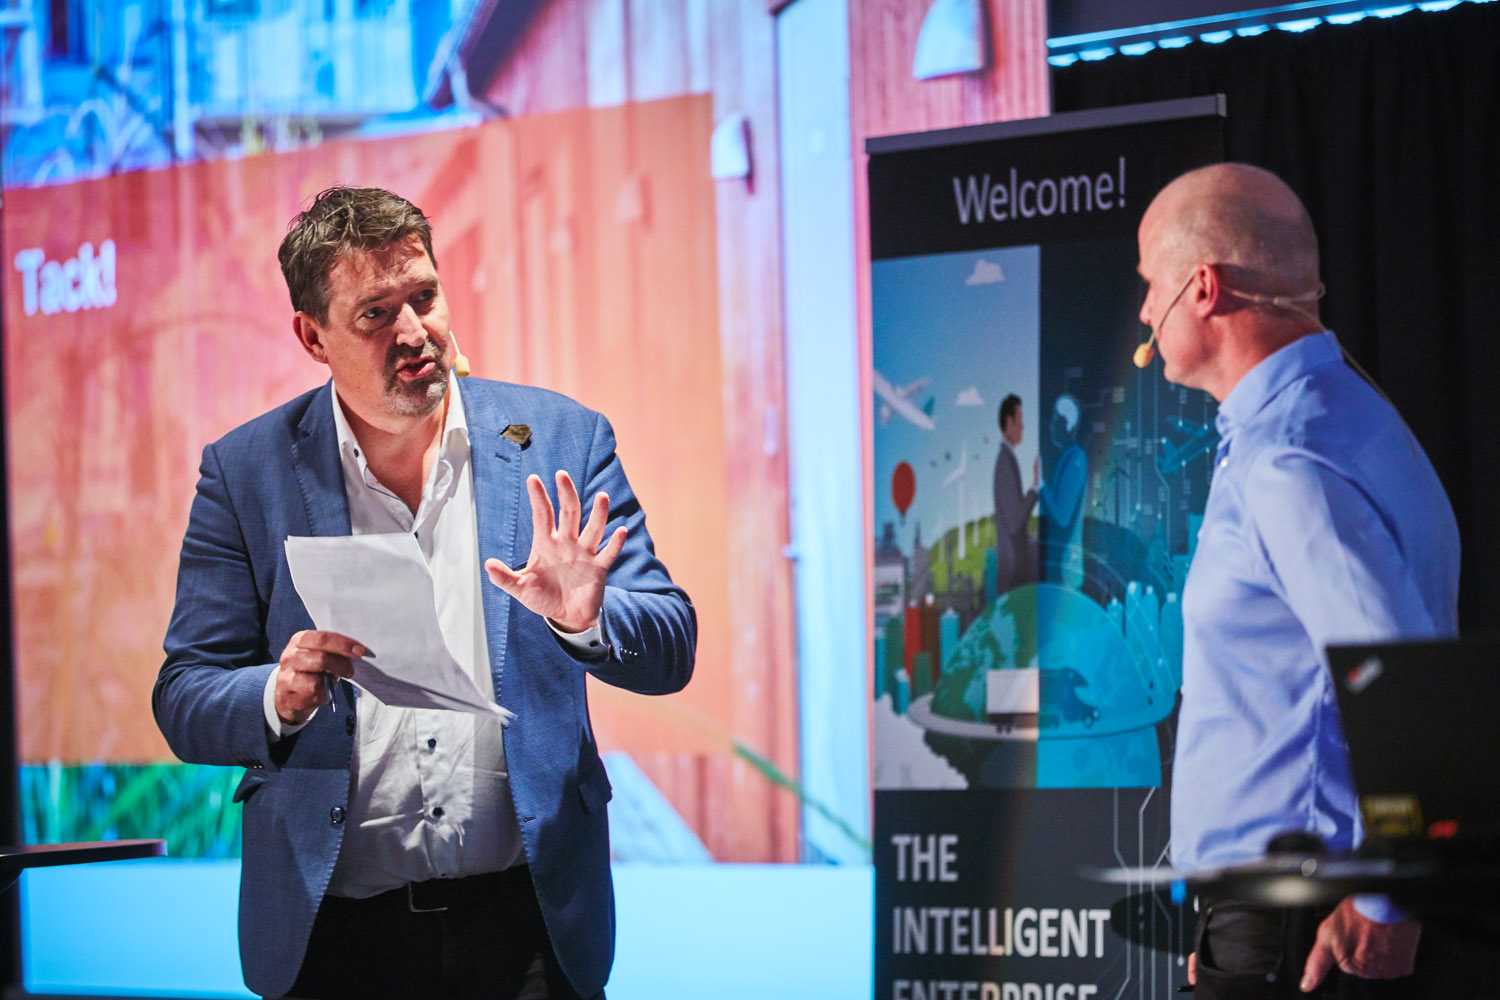
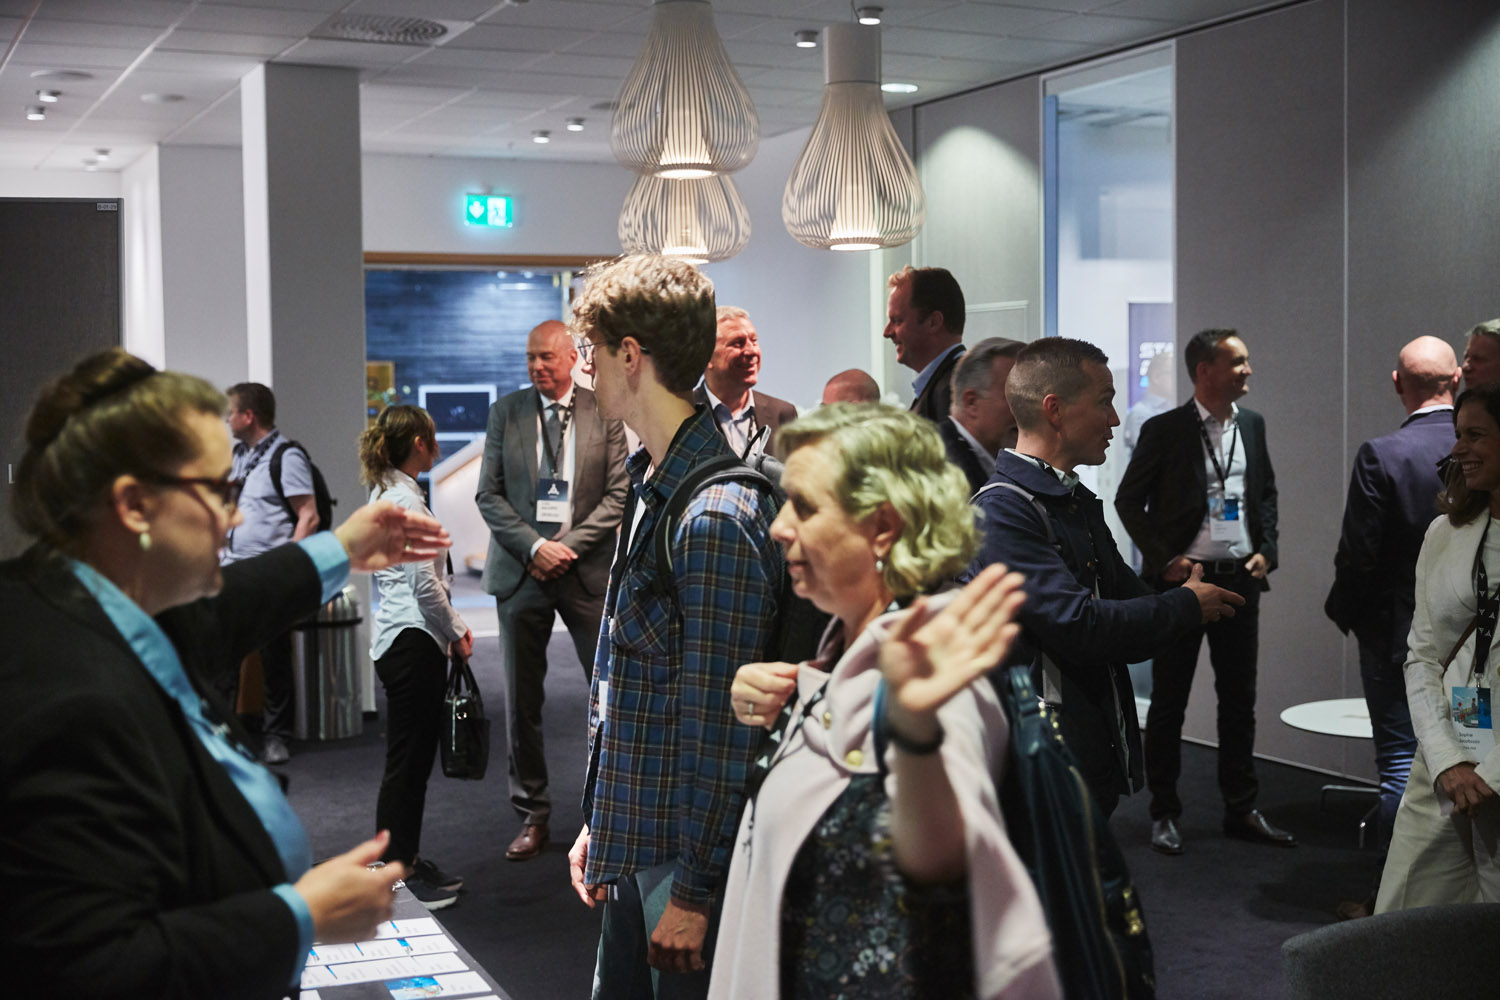
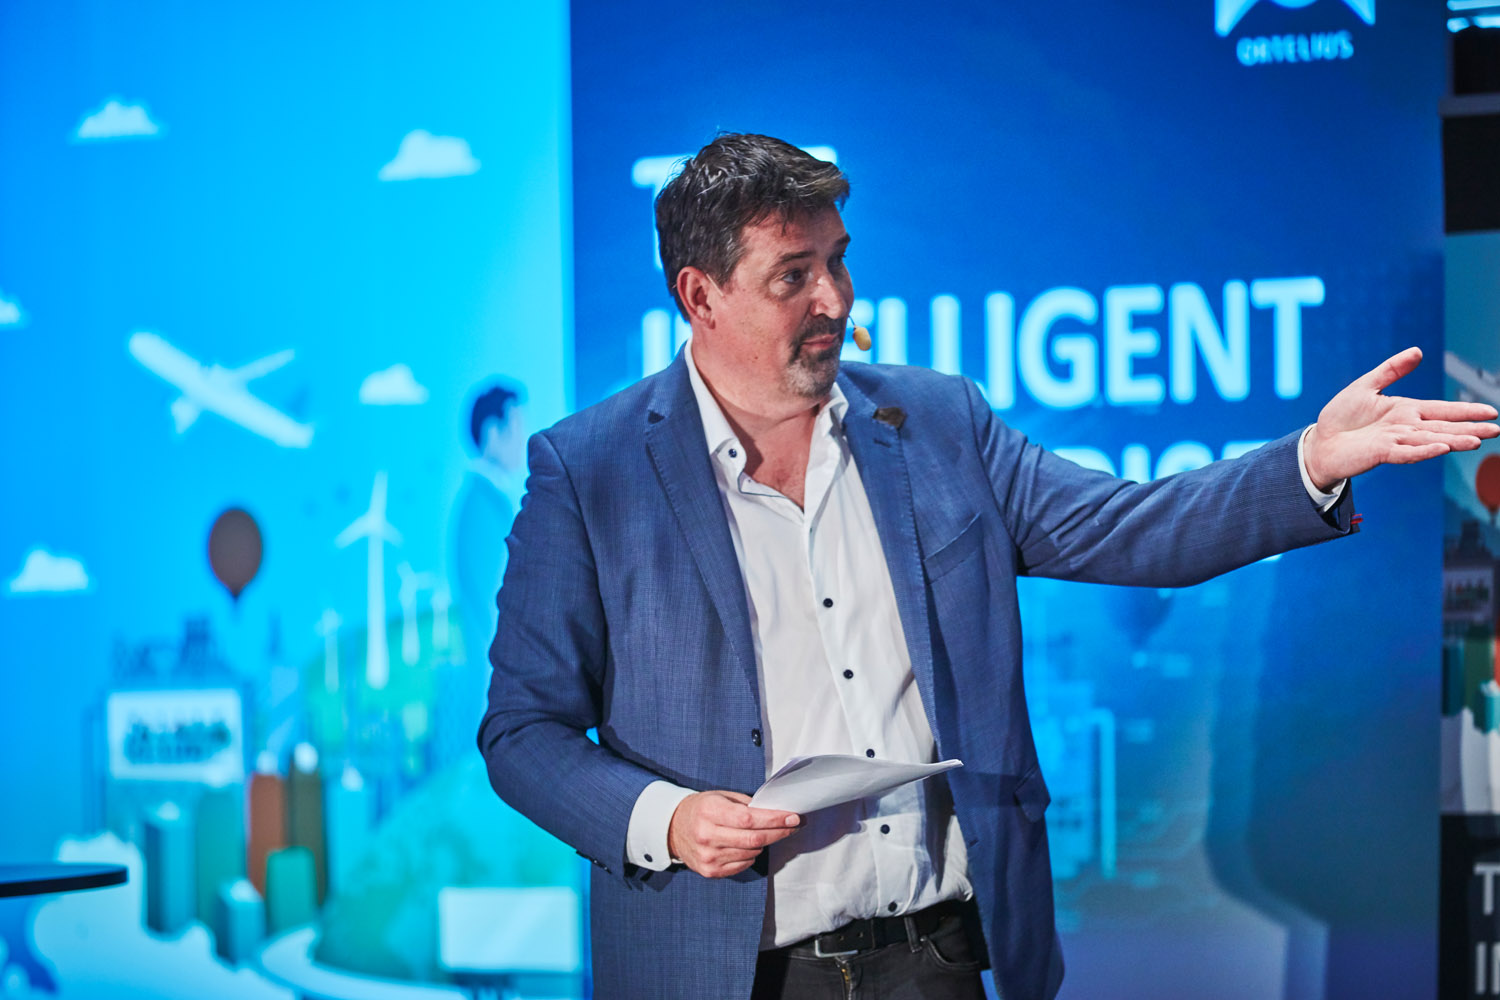
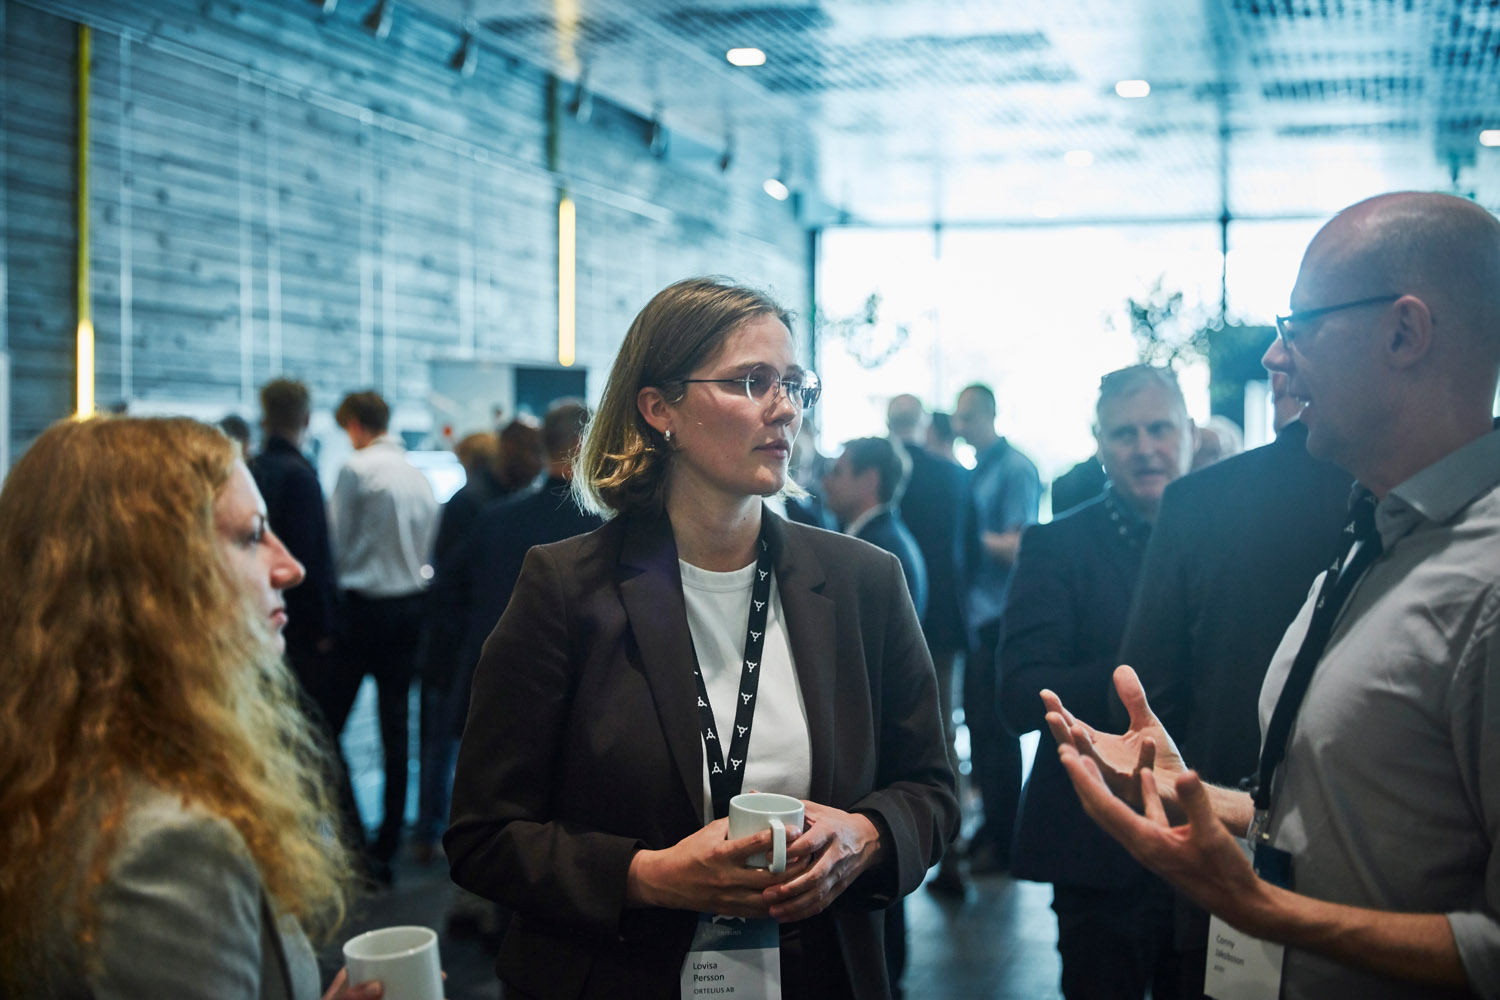
On May 19, 2022 we held our fifth Intelligent Enterprise Conference in Malmö.
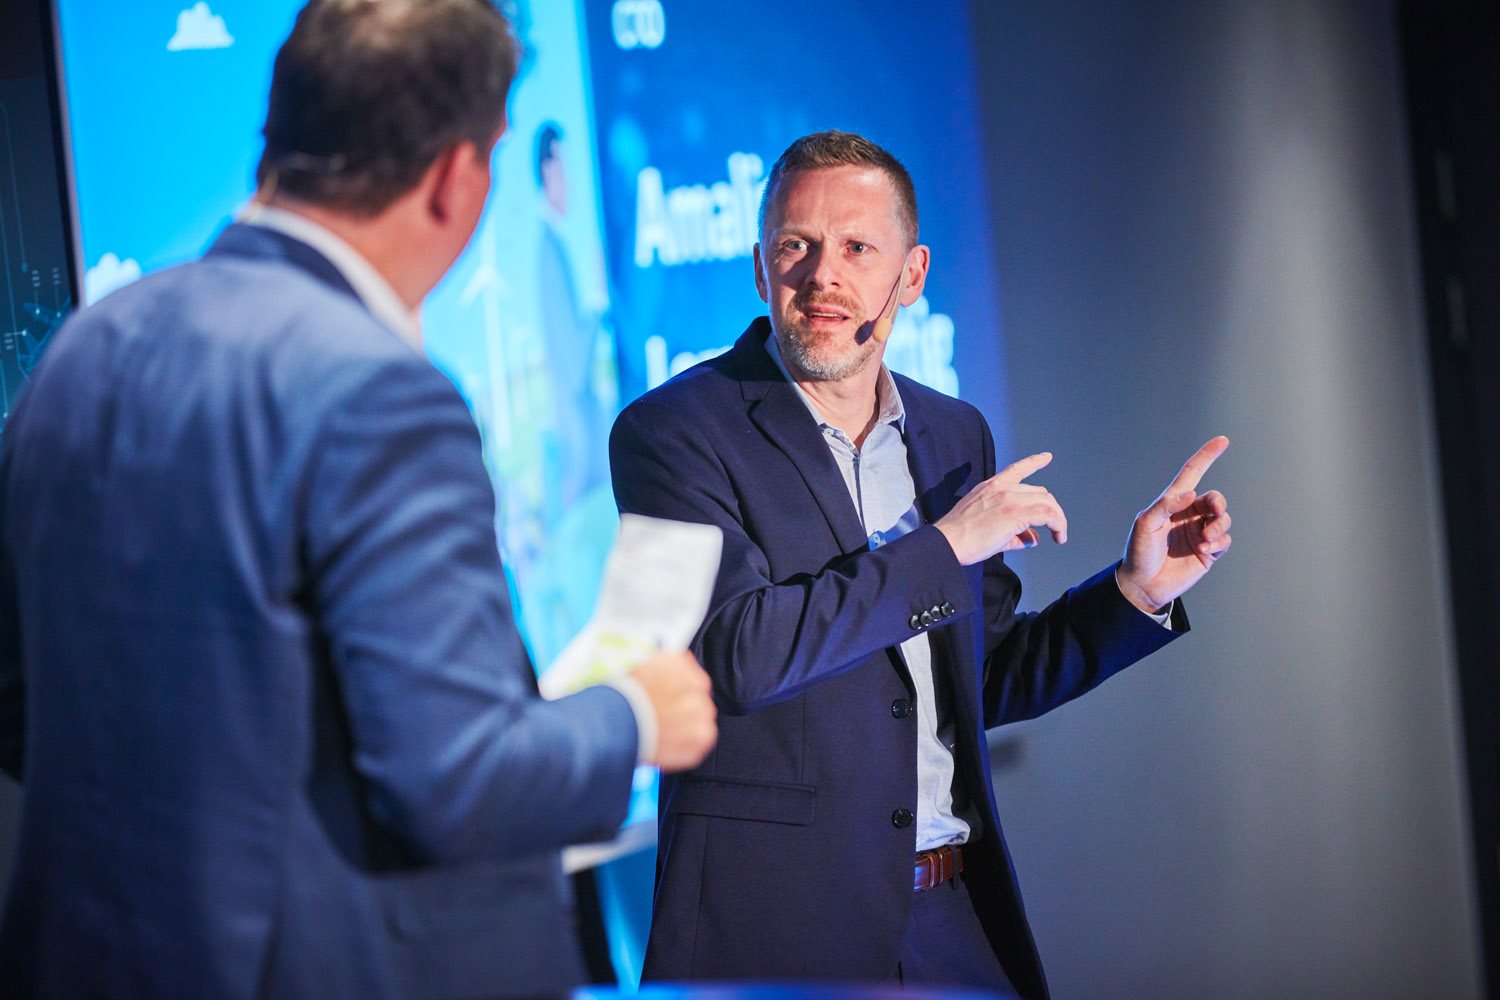
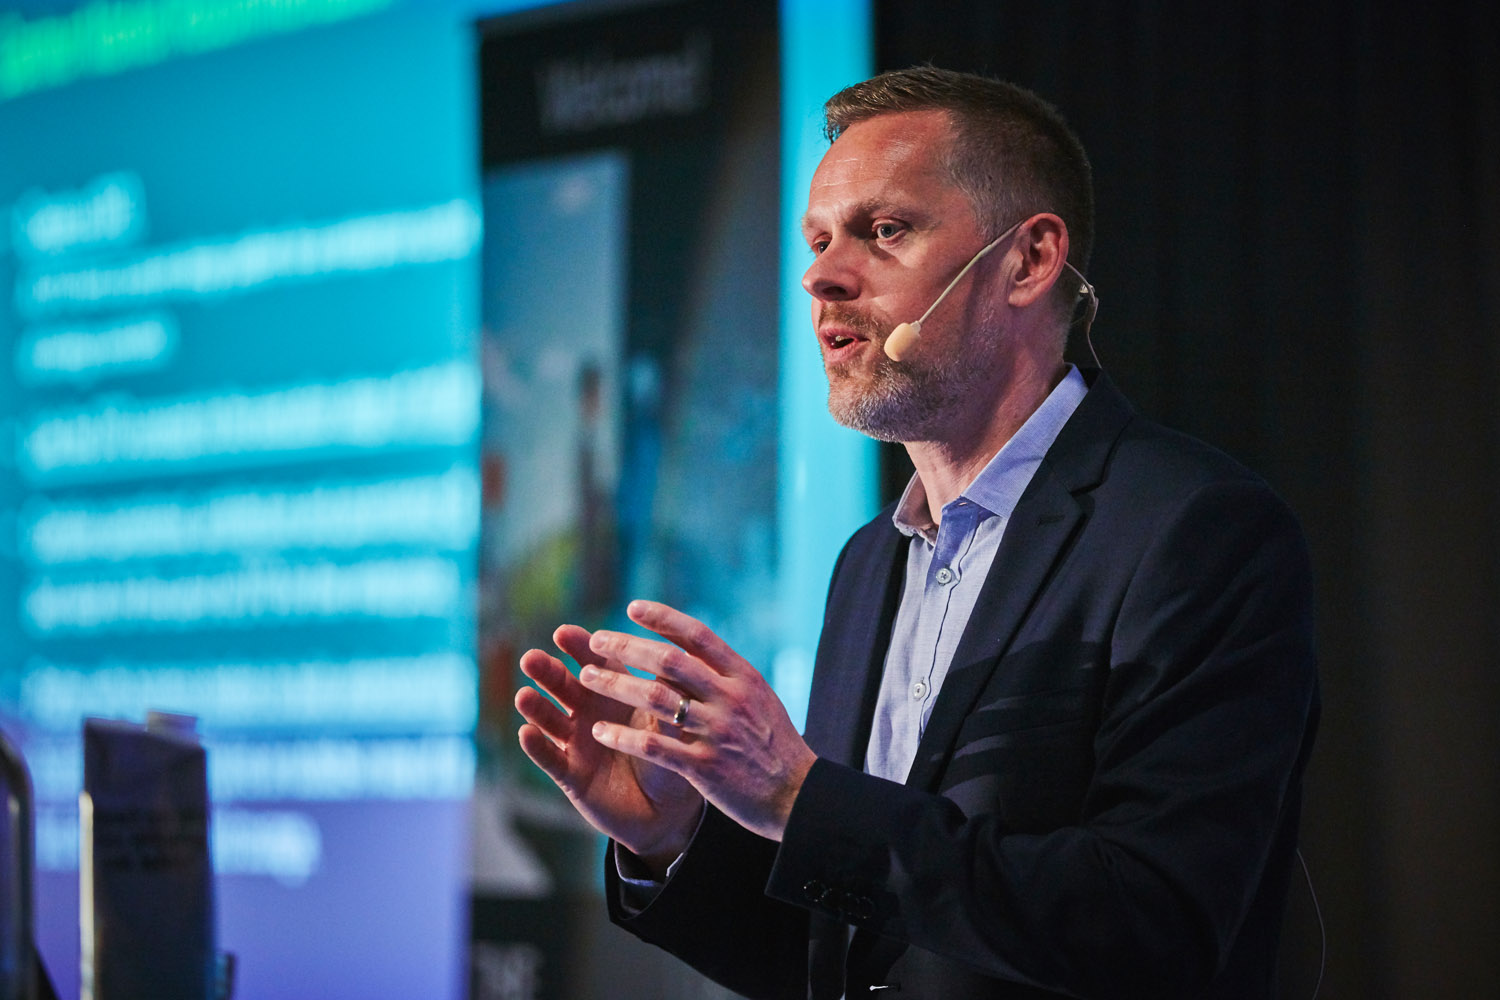
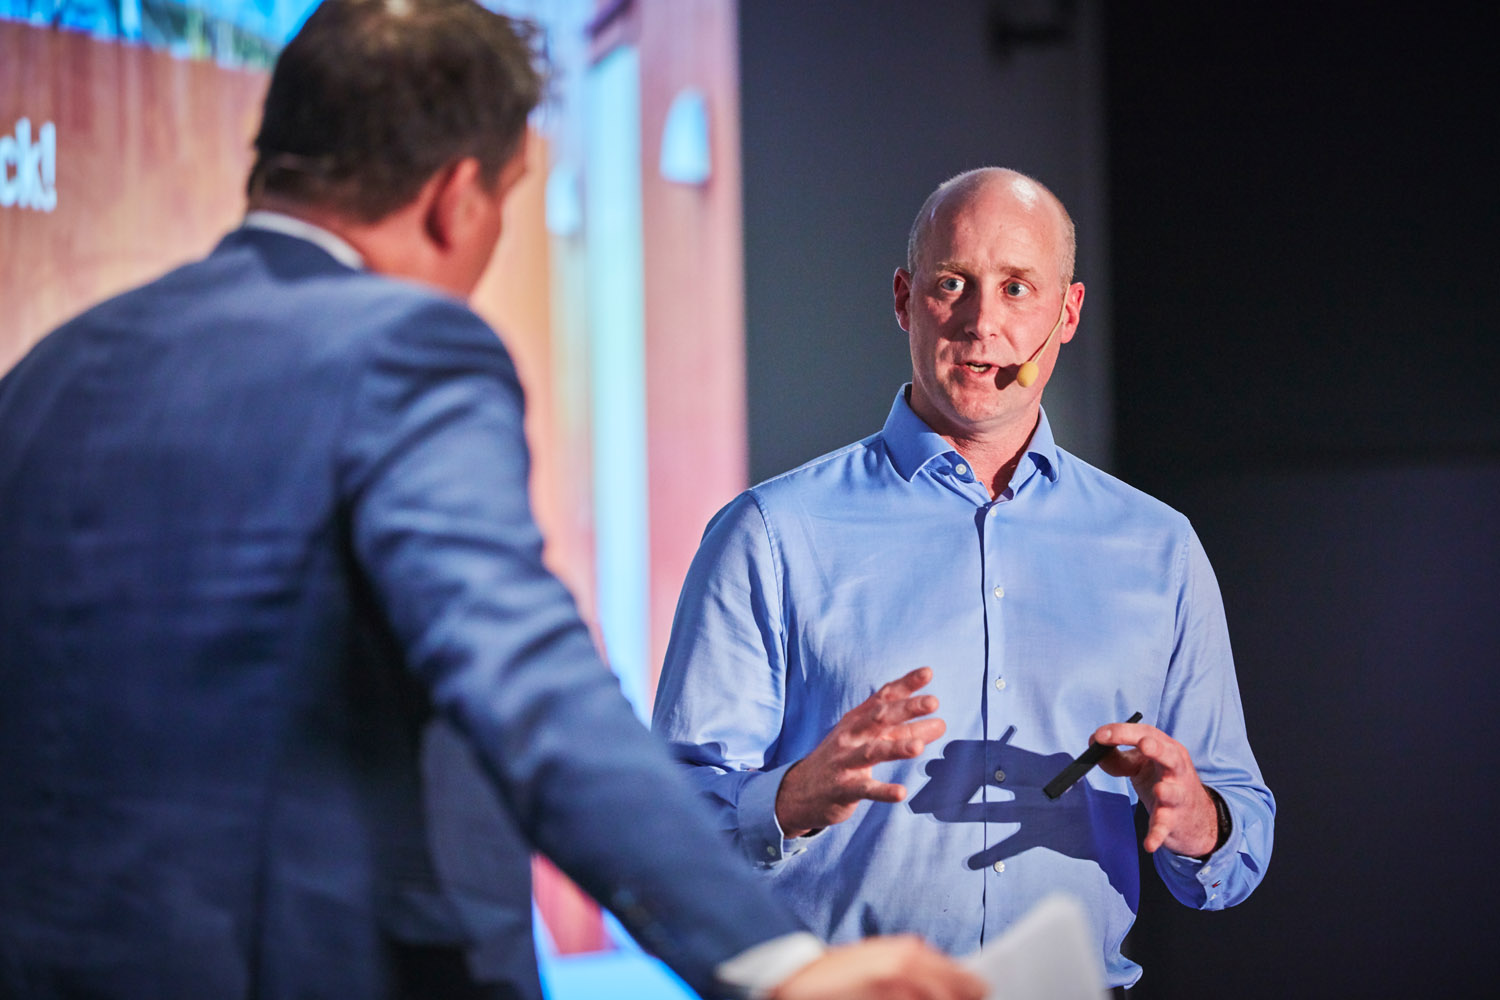
We would like to thank everyone who came, and hope we were able to provide you with new insights and inspiration about a Digital Twin of an Organization, Prototyping and Sustainability!

What is a Digital Twin of an Enterprise?

Joakim Gyllin
Head of Customer Success at Ortelius

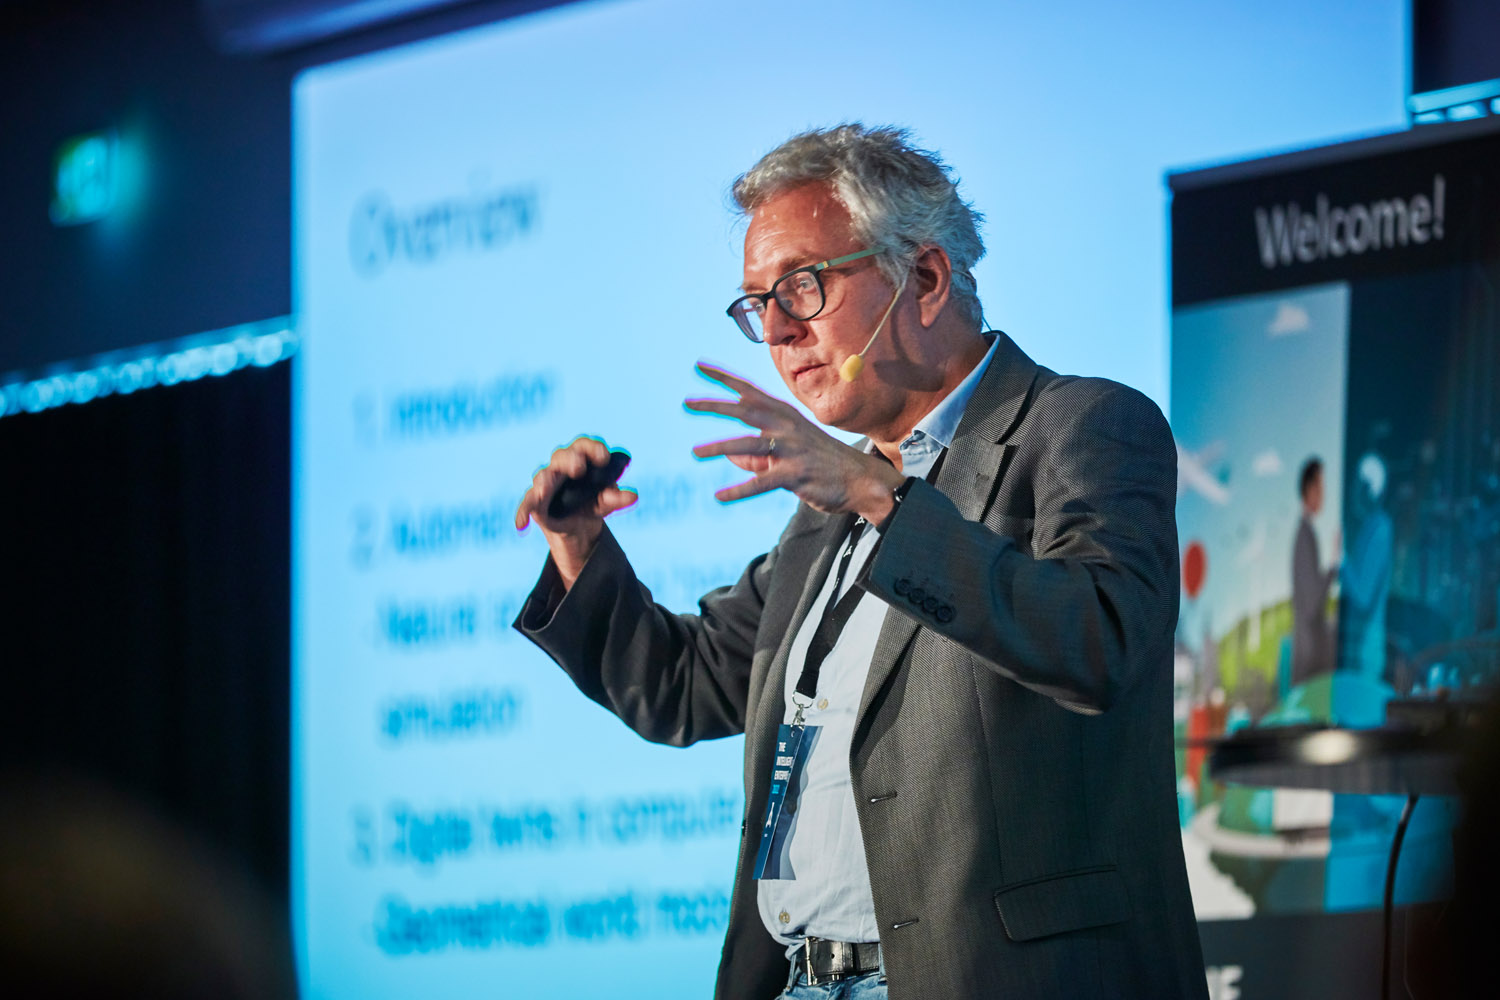
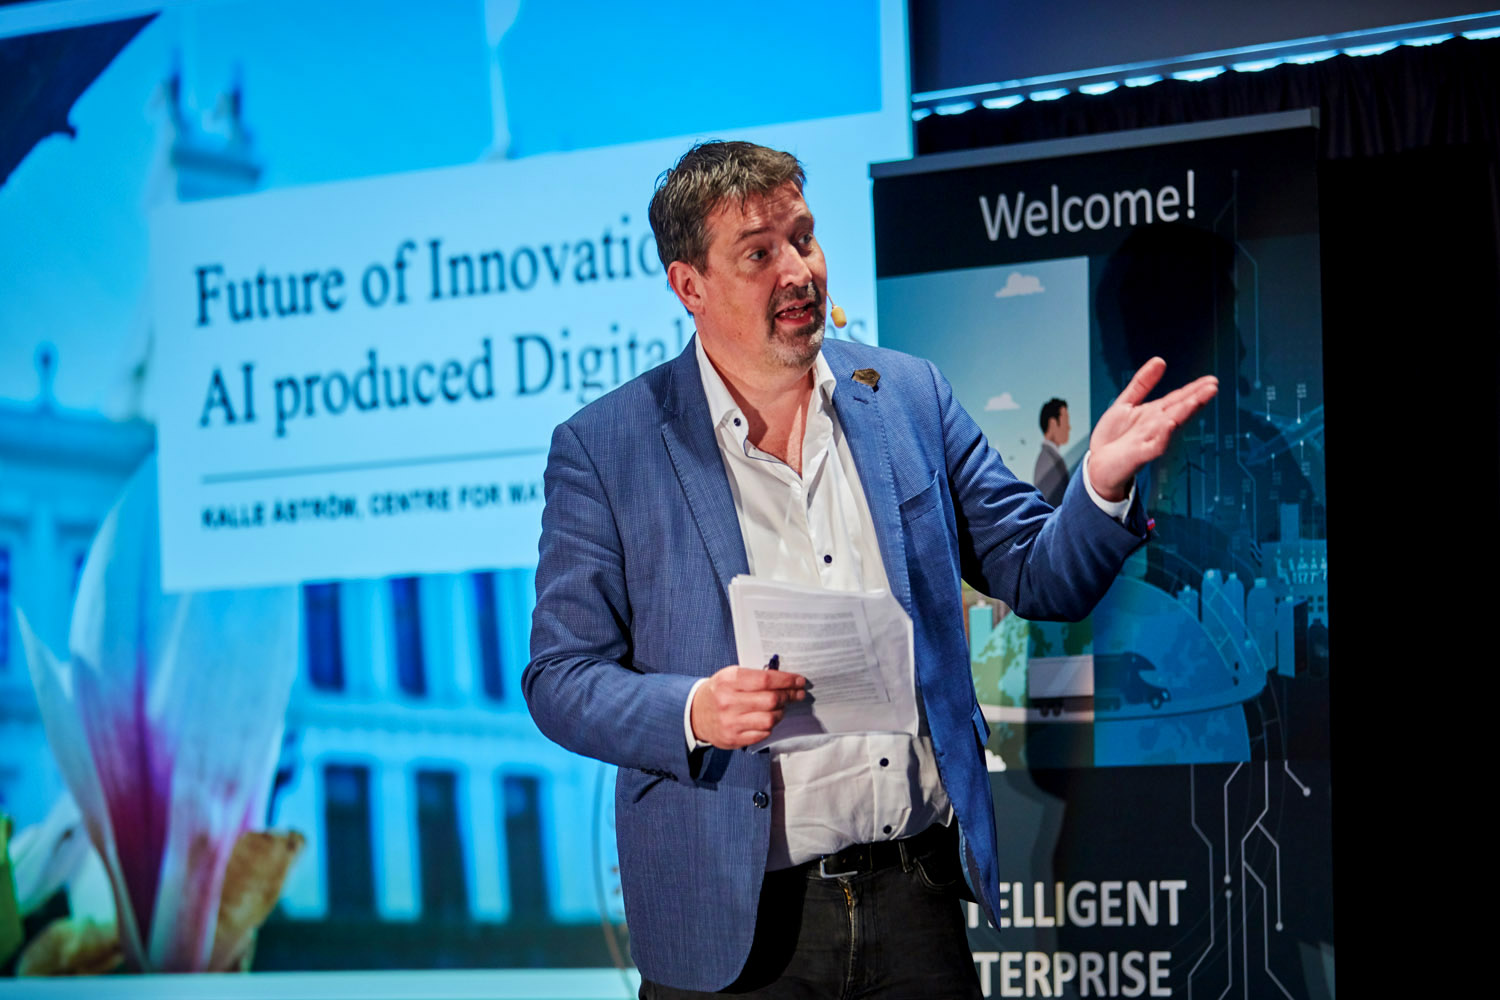
Future of Innovation

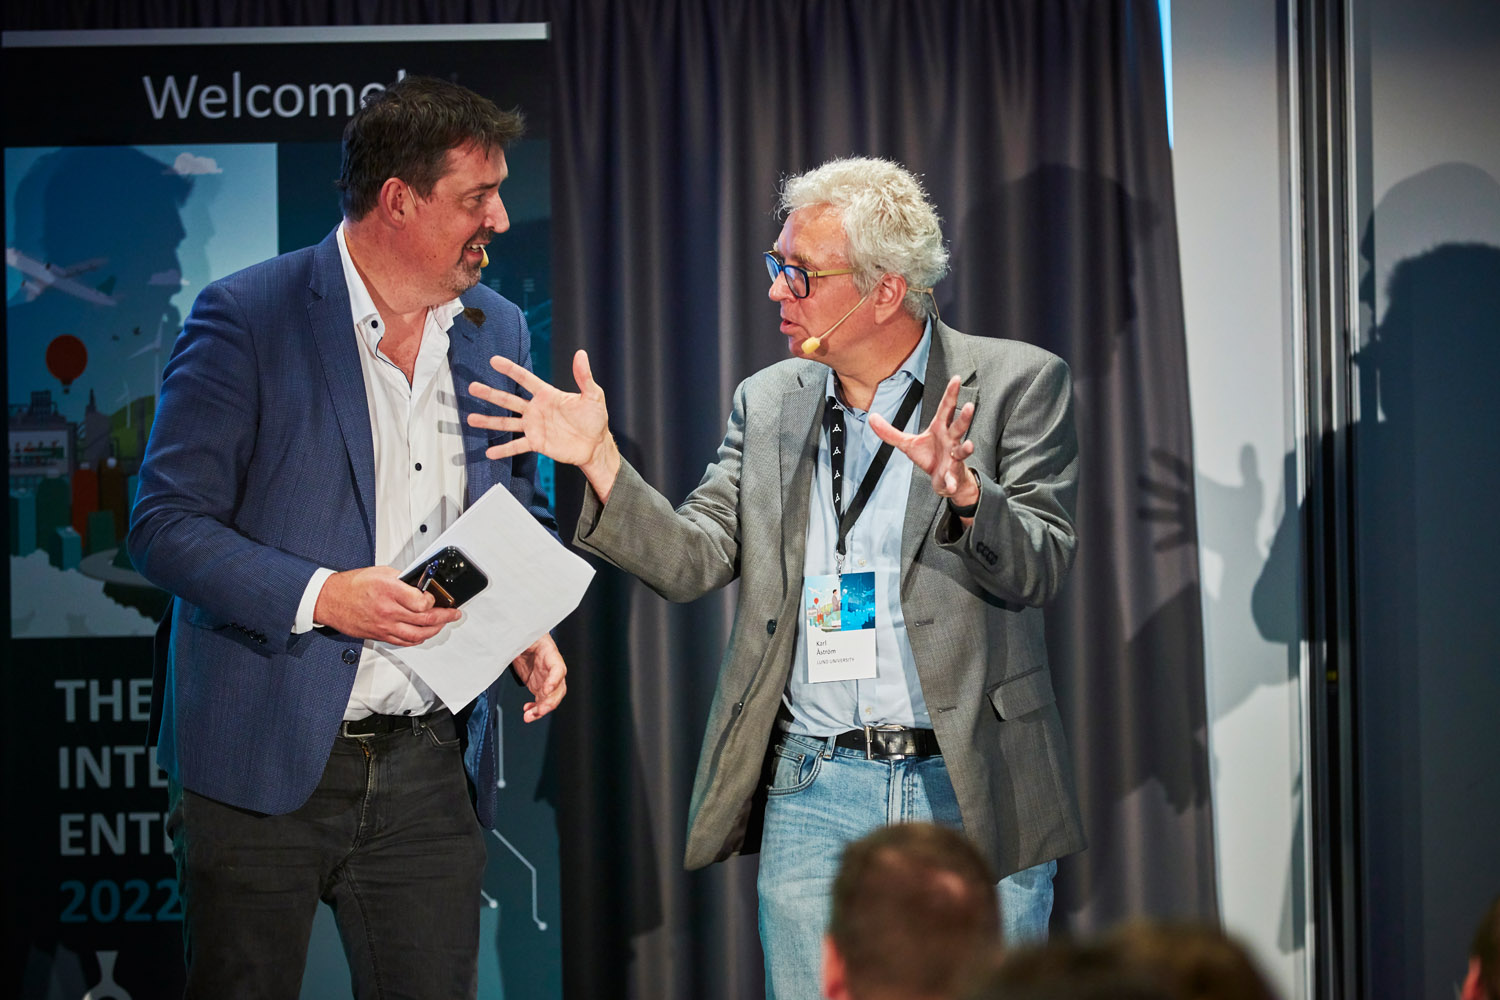
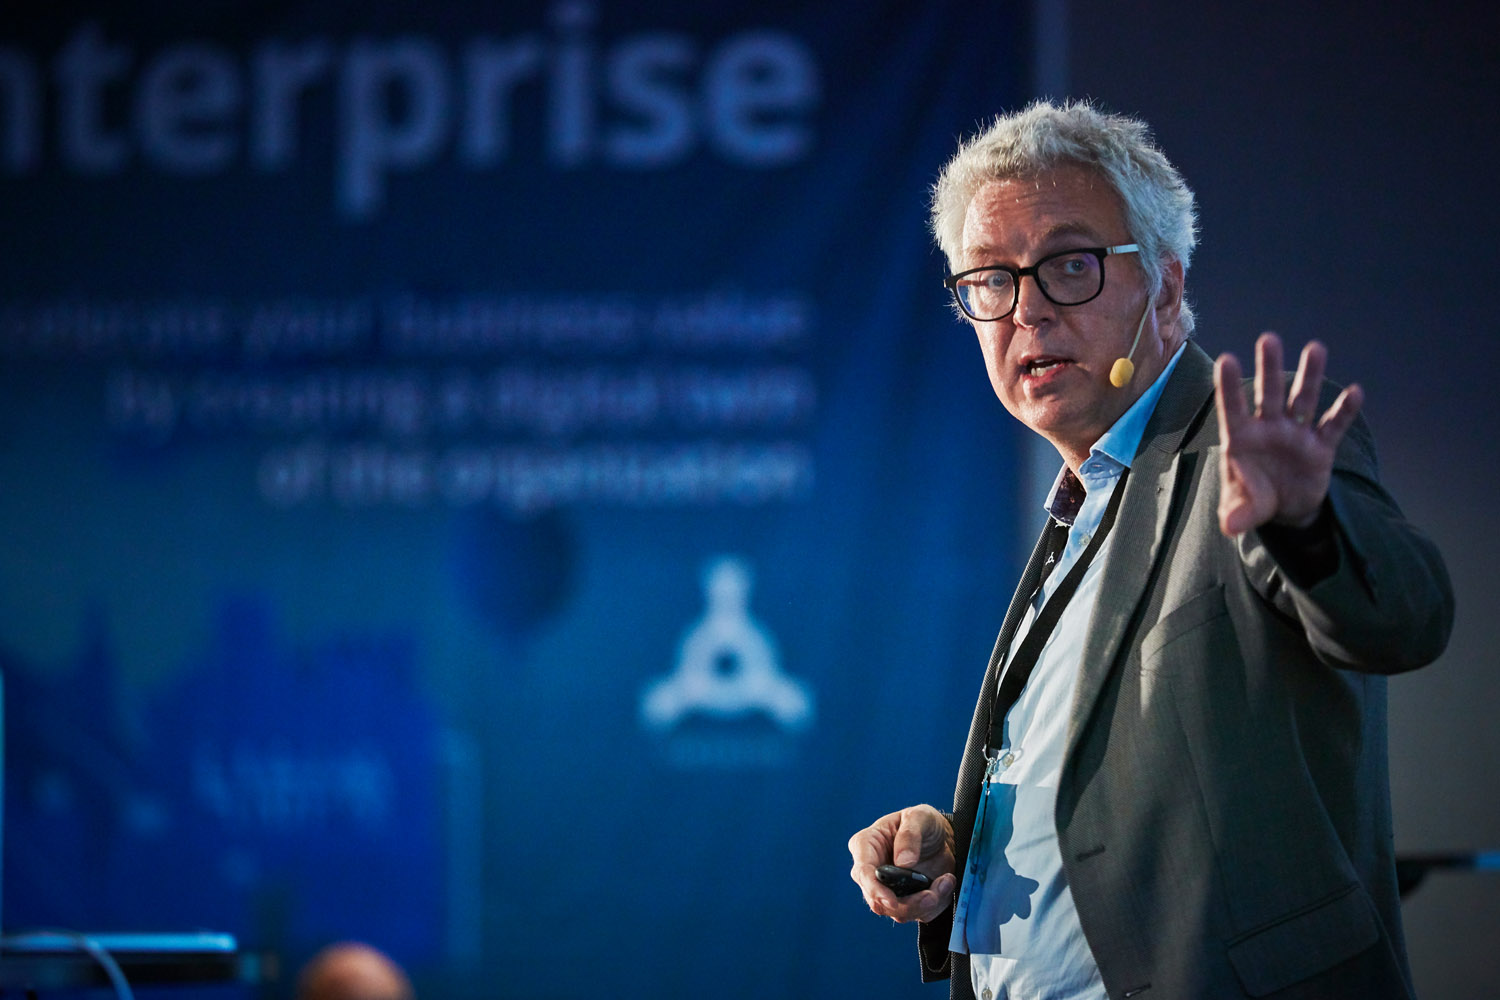
Karl Åström
Professor at Mathematics, Faculty of Engineering at Lund University

Prototyping & Scalability supported by Digital Twins

Mattias Lindström
Head of Products and Technology at PEAB  

Utilizing a Digital Twin for Strategic Change

Carl Widigsson
IT Strategist at Sandvik Coromant

How to start working with Ortelius and digital twin technology

Stefan Dageson
CTO at Ortelius

Amalia Larsson-Hurtig
Business Development Consultant at Ortelius

Ortelius partners with Anderson MacGyver to explore a digital twin platform for the European market

Publicerad: 19 September, 2022 av Alexandra Jerrebro |

May 31, 2022 – Malmö, Sweden

Malmö, Sweden – Swedish Ortelius, a digital twin technology company, announces their strategic partnership with Dutch management consulting firm Anderson MacGyver.

Anderson MacGyver is Ortelius’ first partner in Europe. The objective of the partnership is to join forces to solve customers’ complex information management challenges by using the Ortelius developed inorigo® software platform and Anderson MacGyver’s expertise in organizing data and technology.

“We are excited to team up with Anderson MacGyver to complement each other’s capabilities. Ortelius uses inorigo® to build digital twins through information modelling and prototyping, and our partnership with Anderson MacGyver provides a unique opportunity to further explore other inorigo® capabilities as a software. The platform enables an infinite number of possible solutions, and we are excited to see Anderson MacGyver’s modelling and innovation journey to help their customers,” says Ulf Jensen, CEO of Ortelius.

Anderson MacGyver’s first objective is to develop their data driven consultancy practices and enable better comparability between customer cases. As an IP based consultancy company, Anderson MacGyver seeks to digitalize their key consultancy models and harness the power of data driven advice. While taking the hassle out of keeping data and visualizations in sync using standard office tooling.
“The inorigo® platform allows us to digitalize our consultancy models and create the exact data constructs that we need to answer our client’s management questions and support them in their strategic decision making. We embrace Ortelius’ extensive knowledge and capabilities in data modelling in shaping our own digitalization journey,” says Peter van Steene, Product Lead Inox at Anderson MacGyver.

Consulting firms, like Anderson MacGyver, are able to develop customized solutions with and on inorigo® for their own organization as well as for their customers. The platform enables building a common language for all data, relations and activities in a business; and enables systems to “speak” with each other. The common language allows communication between people, between people and systems, and between systems

We embrace Ortelius’ extensive knowledge and capabilities in data modelling in shaping our own digitalization journey.

Peter van Steene, Product Lead Inox at Anderson MacGyver

About Ortelius

We are a Swedish digital twin company, ensuring customers have structured databases and enabling companies to visualize opportunities. By way of information modelling, we create dynamic digital models of businesses for customers to visualize and understand their current and future scenarios. We provide the expertise in designing taxonomy and ontology based solutions. We are a management consultancy company.

Ortelius announces the release of inorigo® 3rd Generation to the market
Publicerad: 19 September, 2022 av Alexandra Jerrebro |

March 29, 2022 – Malmö, Sweden

The 3rd generation of the award-winning inorigo® software platform have taken another big step towards its vision to help businesses transform more coordinated, more precise, faster and without having to be dependent on programming wizards or database experts.
The platform has a unique database capability which combines hierarchical, relational and graph functions, enabling highly interconnected, flexible and accurate models of the business world. By utilizing scientific taxonomy and ontology principles, inorigo® ensures that organizations can have one common enterprise wide “definition language” of their business-critical information. The implementation allows for customers to improve the collective business decision making, based on an accurate 360-view of the entire enterprise.

“This comprehensive launch is really in line with our vision. With inorigo®, we can find out what is the right complex challenges to solve for our customers and solve them with our team of business consultants, not having to program one single line of code. This software release ensures simplicity in order for customers to take ownership of their own digital transformation using inorigo®. It also provides customers with the tools to focus on accelerated growth and trustworthy data to base decisions upon. We work closely with our customers and pay attention to their needs and requirements. Together with them and an innovative mindset, our new software generation is the result,” said Ulf Jensen, CEO at Ortelius.

The focus of the 3rd generation is to improve data exchange between systems and to extend the low code capabilities. The inorigo® platform makes collective human and machine decision making possible through an extensive set of visualizing exploratory tools and web services. The inorigo® software includes features for application builders, database designers and more intuitive support to build datasets. This software release is a new type of platform that also provides enhanced interface, increased productivity as well as ensured intuitive guidance for the end customer.

“inorigo® enables an unseen flexibility in modeling. When a common language is evolved for the entire business and all its data, activities and relations, it enables the organization to exchange systems and integrate new business models much easier. This is amongst the most comprehensive and important work we have done on our software,” said Stefan Dageson, CTO at Ortelius.

inorigo® enables an unseen flexibility in modeling.

Stefan Dageson, CTO at Ortelius

About Ortelius

We are a Swedish digital twin company, ensuring customers have structured databases and enabling companies to visualize opportunities. By way of information modelling, we create dynamic digital models of businesses for customers to visualize and understand their current and future scenarios. We provide the expertise in designing taxonomy and ontology based solutions. We are a management consultancy company.

Ortelius AB

Head office:
Södra Förstadsgatan 31
211 43 Malmö
Sweden
Phone: +46 40 699 5000
info@ortelius.com

About Us

We are a Swedish company focused on digital twins and composable business. We ensure customers have structured databases and enable companies to visualize opportunities. By way of information modelling, we create dynamic digital models of businesses for customers to visualize and understand their current and future scenarios. We provide the expertise in designing taxonomy and ontology based solutions. Today, our clients include many of Sweden’s largest companies and a few international giants.